


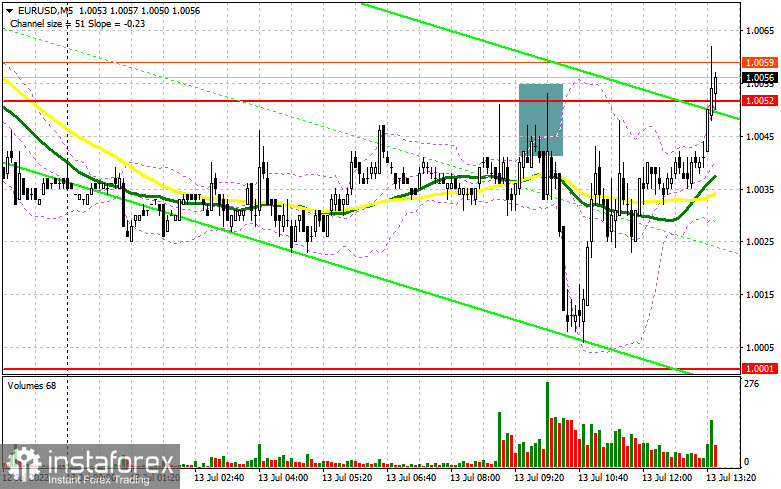
In the morning article, I highlighted the level of 1.0052 and recommended making decisions with this level in focus. Now let's look at the 5-minute chart and try to figure out what actually happened. A small upward rebound of the euro/dollar pair at the beginning of the European session led to a false breakout of 1.0052 and a sell signal. As a result, the pair dropped by about 35 pips. Yet, it failed to reach the nearest support level of 1.0001. The technical outlook has not changed so far as well as the strategy.
What is needed to open long positions on EUR/USD
As I have mentioned many times, today's CPI data will impact the Fed's further moves on monetary policy. A sharp jump in inflation above economists' forecasts will force the regulator to raise the interest rate by another 0.75% this month. The central bank will also maintain hawkish rhetoric at the next meeting scheduled for early autumn this year. Naturally, it will be rather bullish for the US dollar. However, it may also trigger a sell-off of the euro. The technical outlook has not changed. Bulls and bears are tussling for the resistance level of 1.0052. Time will show which party will eventually take the upper hand. In case of a sharp drop following the inflation report, buyers will have to defend the nearest support level of 1.0001. Only after a false breakout of this level, an upward correction may take place. An equally important target is the resistance level of 1.0052. At this level, the moving averages are passing in negative territory. A breakout and a downward test of this level will erase most of the sellers' stop-loss orders, giving a buy signal. If so, the price may also climb to 1.0116. However, it is too early to talk about the upward correction. The situation will be more or less clear after the release of CPI data. At the level of 1.0116, the bears will try to build the upper border of the downward channel. It may limit the pair's growth. A more distant target will be the 1.0182 level where I recommend locking in profits. If EUR/USD declines and bulls show no activity at 1.0001 in the afternoon, which is more likely, the euro may face bearish pressure again. In this case, it is better to stay away from the market. I would advise opening long positions after a false breakout of 0.9958. You can buy EUR/USD immediately at a bounce from the 0.9915 level or even a low of 0.9886, keeping in mind an upward intraday correction of 30-35pips.
What is needed to open short positions on EUR/USD
As long as the pair is trading below 1.0052, bears will remain in control. If EUR/USD rises in the afternoon, a false breakout, similar to one I have mentioned above, along with strong inflation data will generate a sell signal. If so, the pair may decline to the support level of 1.0001, which is the last level on the way to parity with the US dollar. A breakout and a drop below this level, as well as an upward test, will provide an additional sell signal. Buyers will have to close their stop-loss orders, pushing the pair down to 0.9958. If it slides below this level, then it is sure to decrease to 0.9915 where I recommend closing all short positions. A more distant target will be the 0.9886 level. If EUR/USD advances during the American session and bears show no energy at 1.0052, it is better to cancel short positions until a more attractive resistance level of 1.0116. Only a false breakout of 1.0116 will strengthen the bearish trend as it is unknown how traders will react to CPI data. You can sell EUR/USD immediately at a bounce from a high of 1.0182 or 1.0271, keeping in mind a downward intraday correction of 30-35 pips.
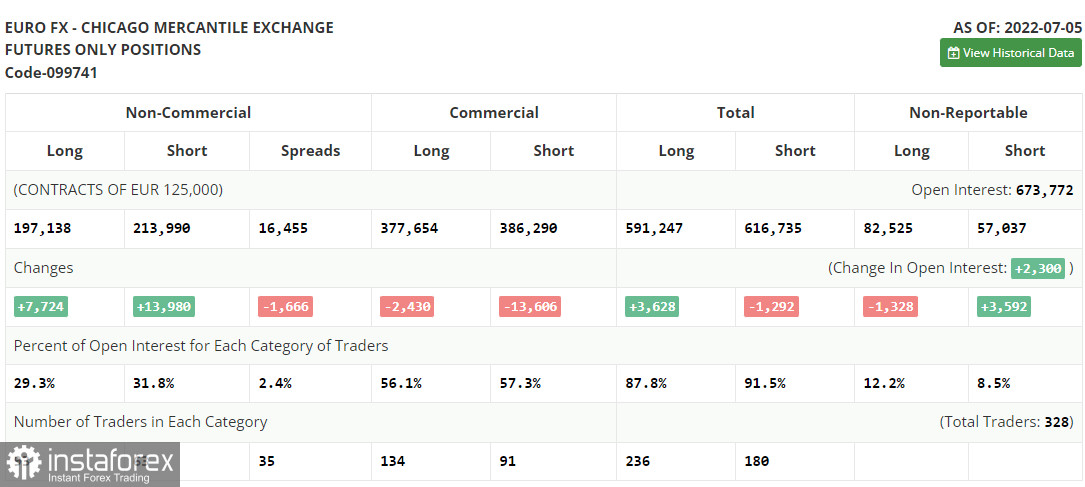
COT The COT report (Commitment of Traders) for July 5 logged an increase in long and short positions. However, short positions exceeded long ones by almost two times. It signals the strength of the bearish bias. It led to a bigger increase in the negative delta. Last week, market participants were disappointed by the eurozone retail sales report. After studying the Nonfarm Payrolls report, the Fed is likely to maintain an aggressive monetary policy to cap galloping inflation. The President of the European Central Bank, Christine Lagarde, also spoke about the need to start raising the interest rate to curb inflation. The United States will reveal CPI data on Wednesday. Analysts expect another jump in consumer prices. If this scenario comes true, the US dollar may climb higher against the euro, approaching parity. The COT report revealed that the number of long non-profit positions increased by 7,724 to the level of 197,138, while the number of short non-profit positions climbed by 13,980 to the level of 213,990. The US dollar is approaching new highs amid the low exchange rate of the euro, the need for further aggressive tightening by major central banks, and the recession in many developed countries. At the end of the week, the total non-commercial net position remained negative and amounted to -16,852 against -10,596. The weekly closing price dropped to 1.0316 against 1.0584.
Signals of technical indicators
Moving averages
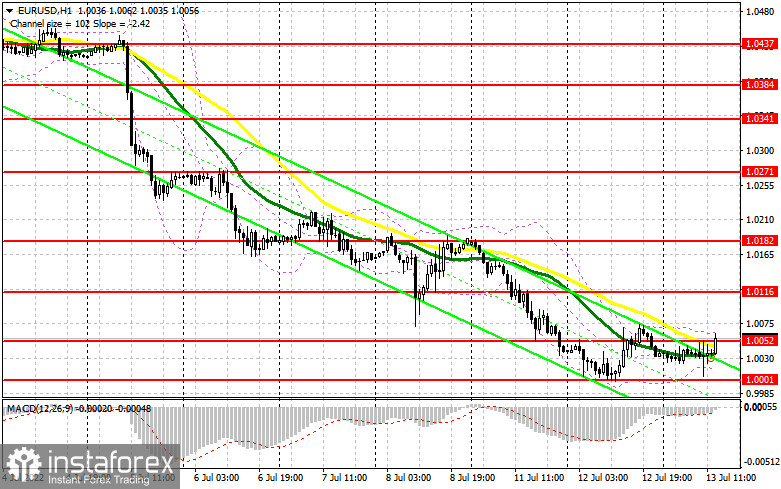
EUR/USD is trading near 30- and 50-period moving averages, which signals market uncertainty.
Remark. The author is analyzing the period and prices of moving averages on the 1-hour chart. So, it differs from the common definition of classic daily moving averages on the daily chart.
Bollinger Bands
In case of an increase, the upper border of 1.0060 will act as resistance.
Definitions of technical indicators
- Moving average recognizes an ongoing trend through leveling out volatility and market noise. A 50-period moving average is plotted yellow on the chart.
- Moving average identifies an ongoing trend through leveling out volatility and market noise. A 30-period moving average is displayed as the green line.
- MACD indicator represents a relationship between two moving averages that is a ratio of Moving Average Convergence/Divergence. The MACD is calculated by subtracting the 26-period Exponential Moving Average (EMA) from the 12-period EMA. A 9-day EMA of the MACD called the "signal line".
- Bollinger Bands is a momentum indicator. The upper and lower bands are typically 2 standard deviations +/- from a 20-day simple moving average.
- Non-commercial traders - speculators such as retail traders, hedge funds and large institutions who use the futures market for speculative purposes and meet certain requirements.
- Non-commercial long positions represent the total long open position of non-commercial traders.
- Non-commercial short positions represent the total short open position of non-commercial traders.
- The overall non-commercial net position balance is the difference between short and long positions of non-commercial traders.


