


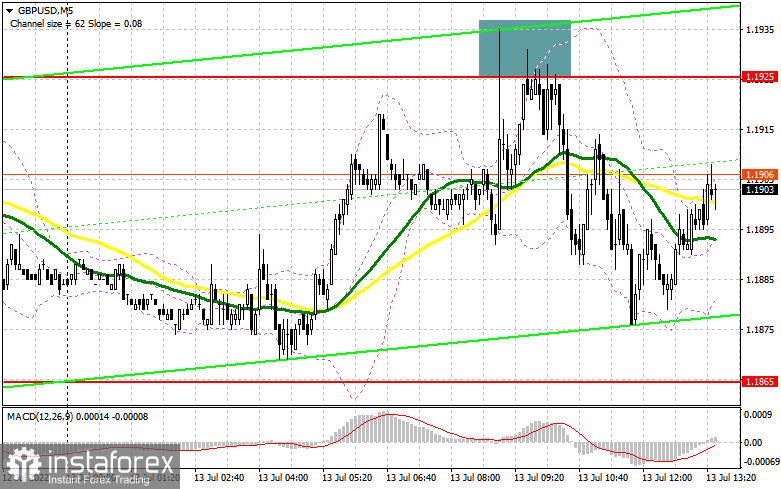
In my morning review, I pointed out the level of 1.1925 and recommended it as a point for entering the market. Let's have a look at the 5-minute chart and find out how the situation has changed there. An upbeat report on GDP in the UK pushed the pound higher towards the level of 1.1925. However, the pound bulls failed to settle above this range. As a result, the pair made a false breakout and generated a sell signal which sent the sterling down by more than 40 pips. From the technical viewpoint, the chart hasn't changed much in the afternoon. So, our strategy also stays the same.
For long positions on GBP/USD:
During the North American session, markets will anticipate an important report on inflation in the US for June. This data will directly influence the future policy of the US Federal Reserve. If the CPI data exceeds expectations and the pound comes under pressure again, we may see the pair returning to yearly lows. It is not clear yet how large market players will behave in this situation. If GBP/USD declines in the afternoon, bulls may assert their strength near the support level of 1.1865. The moving averages that support the bullish trend are passing just above this level. A false breakout of this range will serve as a great signal for opening long positions with the first target found at 1.1925. So far, the pair has failed to break above this mark. Therefore, a retest of this level and its breakout will create a much stronger upside movement. A top-to-bottom test of the 1.1925 level will generate a buy signal for a more rapid jump towards 1.1979. A similar breakout of this level will be possible only if the US inflation data shows that consumer prices have slowed down. This, in turn, will ease the pressure on the Fed. Moreover, this will pave the way towards the area of 1.2034 where I recommend taking profit. A more distant target is seen at the level of 1.2083. A test of this level will indicate the formation of a new upward cycle. In case of a drop and low bullish activity at the level of 1.186, the pound/dollar pair will depreciate further. If so, I would advise you to open long positions only after the price reaches 1.1809, the last point that will dash buyers' hopes for an upside correction. It is better to buy at this level only after a false breakout. It is possible to go long on GBP/USD right after a rebound from 1.1742, or even lower from 1.1647, keeping in mind a possible correction of 30-35 pips within the day.
For short positions on GBP/USD:
Bears have already fought for the level of 1.1925, and a retest of this level may push them back. Yet, the situation is unlikely to change dramatically before the inflation report is out. Now bears have to watch the resistance level of 1.1925. To regain control of the market, the sellers need to break below 1.1865 as soon as they can. This will be a hard task to fulfill given the possible correction developed by the bulls. If GBP/USD rises in the afternoon after the publication of the CPI data in the US, the formation of a false breakout at 1.1925 will create the first entry point for short positions. This will go in line with the downtrend and the possible return of the price to 1.1865. Consolidation below 1.1865 and a retest of this range will trigger stop-loss orders placed by the bulls. This will also create an additional entry point to sell the pound with the downward target at 1.1809. I recommend locking in some profit at this level. A more distant target will be found at the level of 1.1742. A test of this area will indicate the resumption of the downtrend. In the upside scenario and low bearish activity at 1.1925, bulls will take control of the market. If so, I do not recommend buying the pair. Only a false breakout of the next resistance at 1.1979 will create a good point for opening short positions after a possible downside pullback. If nothing happens there as well, the price may rush to the upside amid the canceled stop-loss orders placed by speculative sellers. In this case, I would advise you to open short positions only when the price hits the level of 1.2034. At this point, you can sell GBP/USD right after a rebound, keeping in mind a possible correction of 30-35 pips within the day.
COT report
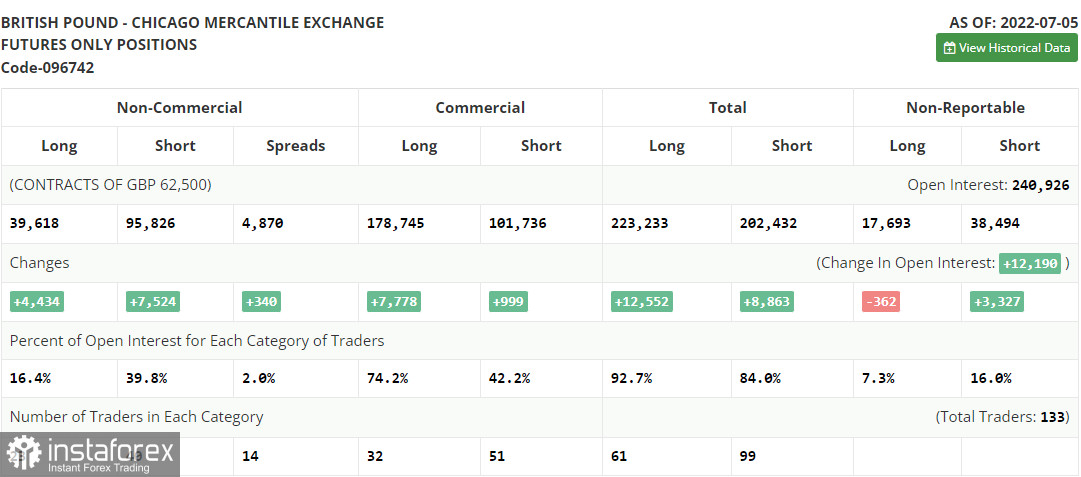
The COT (Commitment of Traders) report for July 5 showed a rise in both short and long positions. However, short positions prevailed which led to an increase in the negative delta. Another attempt to buy the pair near yearly lows failed after it became clear that the Bank of England will keep raising the rate to tackle inflation. This policy will further slow down the UK economy and will push it closer to a recession. The cost of living crisis is getting more acute every day, and the recent resignation of UK Prime Minister Boris Johnson is likely to make things worse. There is currently no reason to buy the pound apart from the fact that it has recently retested yearly lows. The Fed's policy and the pace of monetary tightening in the US provide significant support to the US dollar. Besides, the economic situation in the US is slightly better than in the UK, which is confirmed by the fresh employment data for June. According to the COT report, long positions of the non-commercial group of traders increased by 4,434 to 39,618, while short positions surged by 7,524 to 95,826. As a result, the negative non-commercial net position increased to -56,208 from -53.118. The weekly closing price declined to 1.1965 versus 1.2201.
Indicator signals:
Moving Averages
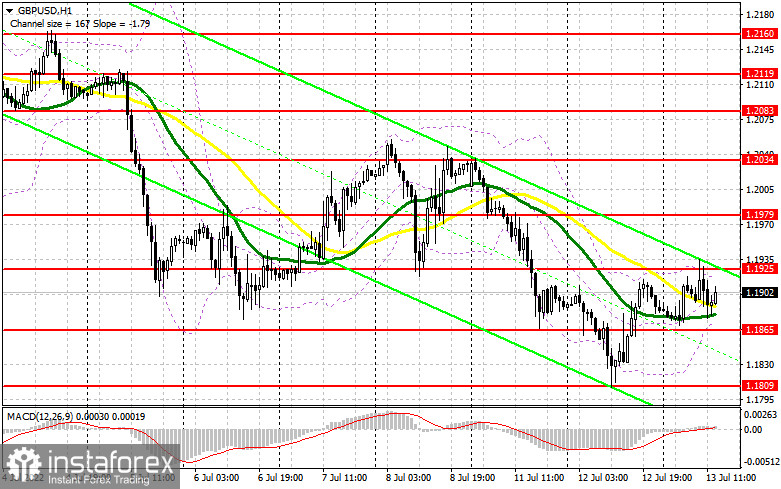
Trading near the 30 and 50-day moving averages indicates market uncertainty and a slowdown in the bearish trend.
Please note that the time period and levels of the moving averages are analyzed only for the H1 chart, which differs from the general definition of the classic daily moving averages on the D1 chart.
Bollinger Bands
In case of an uptrend, the upper band of the indicator at 1.1925 will serve as resistance.
Description of indicators:
• A moving average of a 50-day period determines the current trend by smoothing volatility and noise; marked in yellow on the chart;• A moving average of a 30-day period determines the current trend by smoothing volatility and noise; marked in green on the chart;• MACD Indicator (Moving Average Convergence/Divergence) Fast EMA with a 12-day period; Slow EMA with a 26-day period. SMA with a 9-day period;• Bollinger Bands: 20-day period;• Non-commercial traders are speculators such as individual traders, hedge funds, and large institutions who use the futures market for speculative purposes and meet certain requirements;• Long non-commercial positions represent the total number of long positions opened by non-commercial traders;• Short non-commercial positions represent the total number of short positions opened by non-commercial traders;• The total non-commercial net position is the difference between short and long positions of non-commercial traders.


