


Details of the economic calendar from July 13
The UK manufacturing production rose by 1.4%, which is better than the expected fall of -0.3%. Despite the divergence of expectations, the market ignored the positive statistics.
A similar indicator from the European Union posted an increase of 1.6%. Euro at that time stood still, ignoring the statistics.
The main event was the data on inflation in the United States, which accelerated to 9.1% in annual terms, hitting a high in almost 41 years.
As a result, traders again received confirmation of the stalemate unfolding in the US economy. Naturally, against such a negative background, talk of an even higher increase in the interest rate by 100 basis points at the upcoming Fed meeting began.
All this let the US dollar retain its position in the market.
Analysis of trading charts from July 13
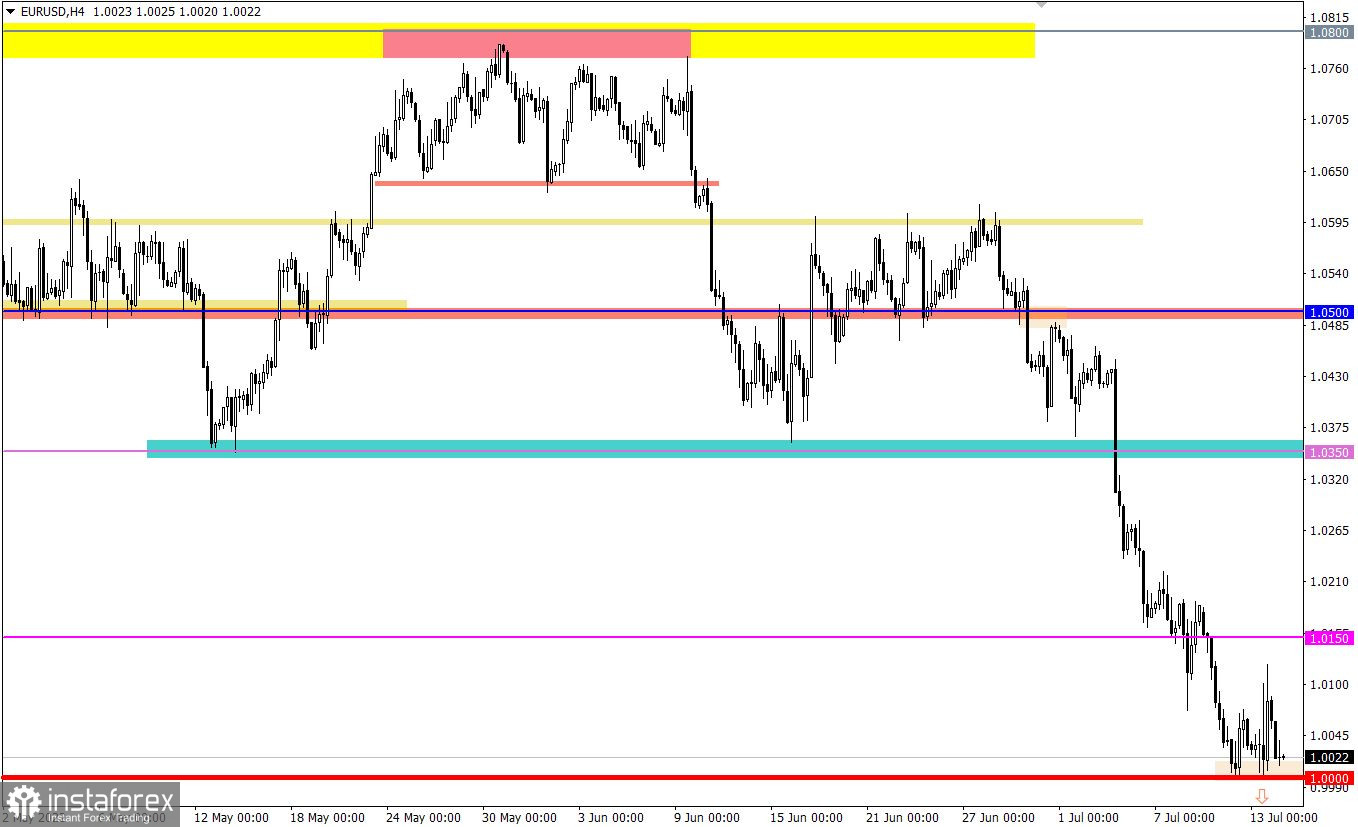
The EURUSD currency pair during the past day managed to show local upward interest, but it was clearly not enough to change the given cycle. As a result, the quote again returned to the parity level, resuming movement within a narrow flat.
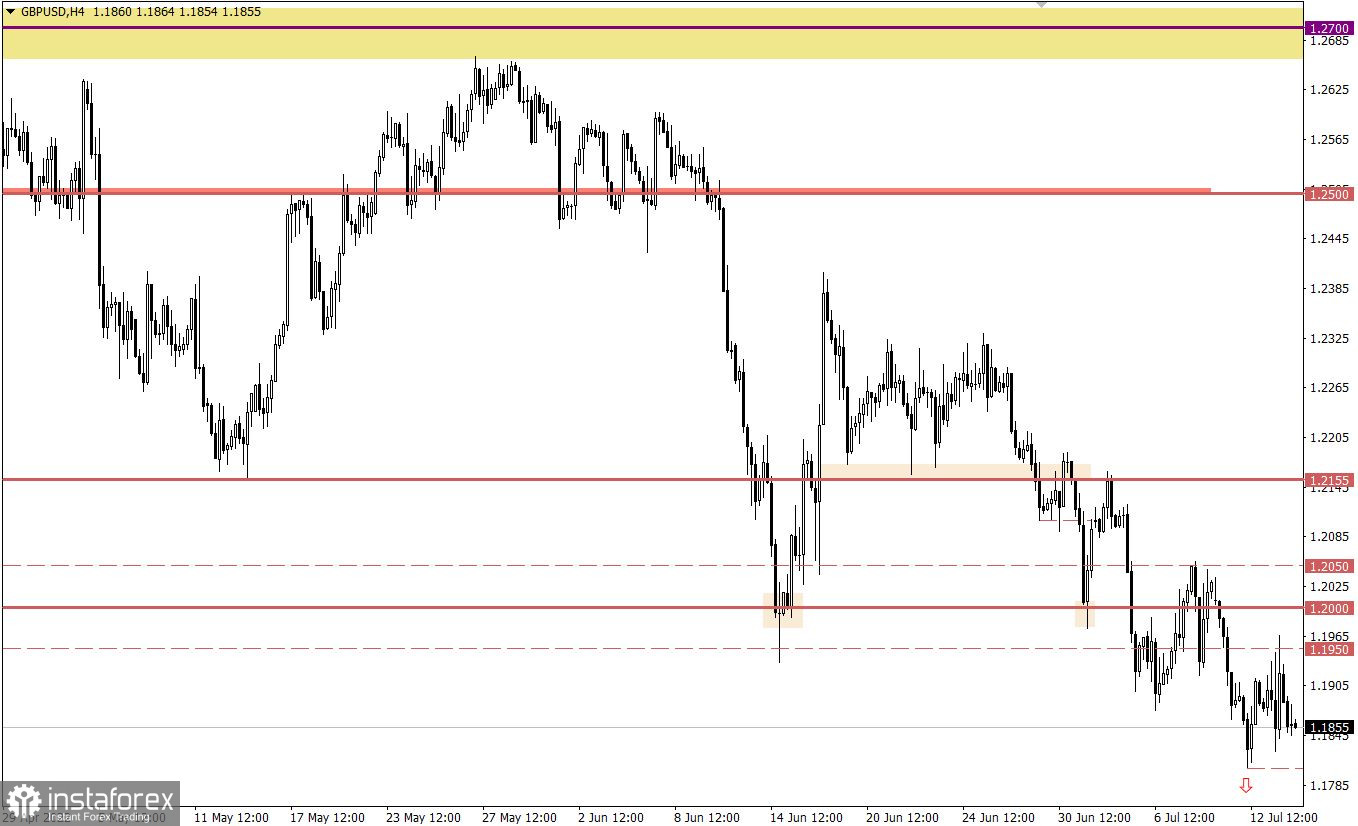
The GBPUSD currency pair, after a short pullback, entered the stagnation stage, which corresponds to the price fluctuation of the correlating EURUSD pair. The absence of a full-length correction suggests that the market retains a strong downward interest among speculators.
Economic calendar for July 14
The producer price index in the United States will be published today, which may rise from 10.8% to 10.9%. This indicator is considered a leading indicator for inflation. If the index rises, inflation will also continue to rise. Thus, the US economy will be under strong inflationary pressure.
Simultaneously, weekly data on US jobless claims will be published, where figures are assumed to rise—a negative factor for the US labor market.
Statistics details:
Continuing claims for benefits may increase from 1.375 million to 1.383 million.
Initial claims for benefits may remain at the same level of 235,000.
Time targeting
US producer price index – 12:30 UTC
US Jobless Claims – 12:30 UTC
Trading plan for EUR/USD on July 14
Despite the high level of oversold euro, the downward interest still remains in the market. The current flat characterizes itself as a process of accumulation of trading forces, eventually leading to new price jumps. If the price holds below the parity level in a four-hour period, the downward cycle will resume in the market, ignoring a number of technical signals. In this scenario, an inertial speculative price move is possible, in which the euro exchange rate may weaken by another 150–200 points.
At the same time, traders still consider a full-fledged correction scenario, indicated by the euro's oversold status. In order for the first signal to buy the euro to appear, the quote must return above 1.0100 in a four-hour period.
Trading plan for GBP/USD on July 14
A new round of short positions is expected in the market after holding the price below 1.1800. This move will strengthen the downward cycle towards the 2020 low. In your work, it is worth considering that, at the moment, the pound sterling goes for the euro. Thus, in the event of a full-fledged correction in the euro, the pound will also move to strengthening.
What is reflected in the trading charts?
A candlestick chart view is graphical rectangles of white and black light, with sticks on top and bottom. When analyzing each candle in detail, you will see its characteristics of a relative period: the opening price, closing price, and maximum and minimum prices.
Horizontal levels are price coordinates, relative to which a stop or a price reversal may occur. These levels are called support and resistance in the market.
Circles and rectangles are highlighted examples where the price of the story unfolded. This color selection indicates horizontal lines that may put pressure on the quote in the future.
The up/down arrows are the reference points of the possible price direction in the future.


