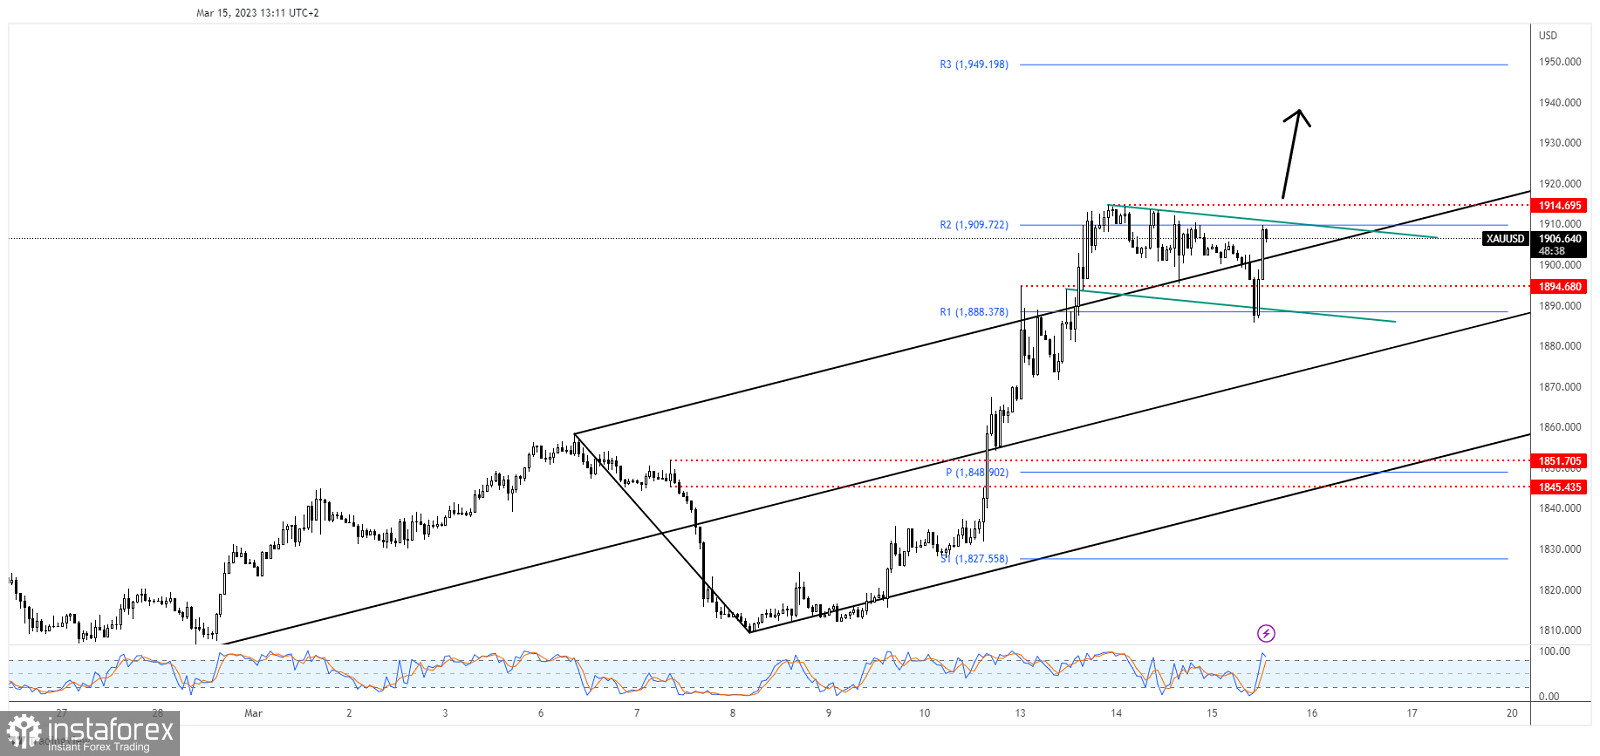
The price of gold rallied in the short term and now is trading at 1,910 at the time of writing. The bias remains bullish despite temporary retreats. You knew from my last analysis that XAU/USD could extend its growth after testing and retesting the support levels.
Today, the Chinese data came in mixed. Still, the US data could be decisive later today. The PPI and Core PPI could increase in the last month while the retail sales data could announce a potential drop in February. Positive US data should boost the USD and could force XAU/USD to slip lower. On the contrary, poor US economic figures should lift the yellow metal.
XAU/USD Flag Pattern!

XAU/USD dropped a little but the sell-off ended after registering only a false breakdown below the channel's downside line and below the weekly R1 (1,888). Now, it could challenge the R2 (1,909, 1,914 static resistance), and the downtrend line.
Technically, the flag pattern (down channel) is seen as a potential upside continuation pattern. Still, we need confirmation before jumping into a long position.
XAU/USD Outlook!
Jumping and closing above 1,914 activates the flag pattern and announces further growth ahead. Validating its breakout above this obstacle represents a bullish signal.


