


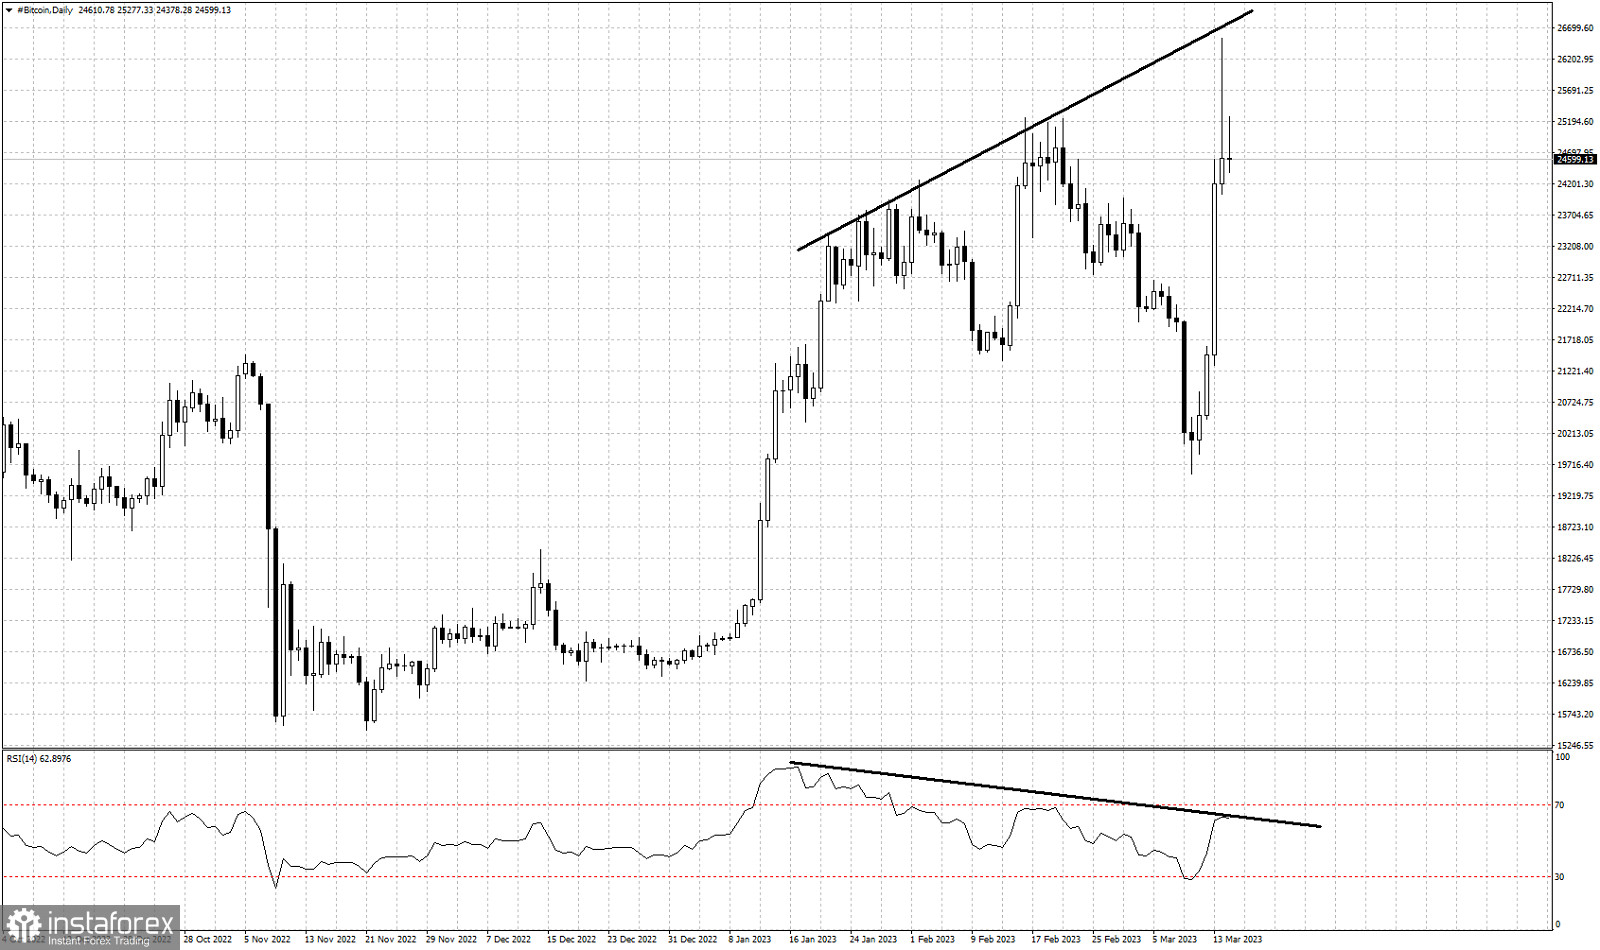
Black line- bearish RSI divergence
Yesterday Bitcoin was breaking above the key resistance of $25,200 and was climbing as high as $26,300. Yesterday's Daily candlestick was an important warning for bulls. Why? Bulls were unable to hold price above the broken resistance and price turned lower to close near daily open. Bitcoin's daily candle formed a long upper tail. This was a sign of weakness as bulls showed that they were not strong enough. Moreover the RSI made a new lower high providing a new bearish RSI divergence in the Daily chart. This is another warning regarding the short-term up trend. This is a sign that the up trend is weakening. As we mentioned yesterday, it is not enough to break resistance but bulls need to maintain price above the resistance levels. Otherwise we will get a fake break out. So far price seems to be confirming the bearish scenario of a fake break out.


