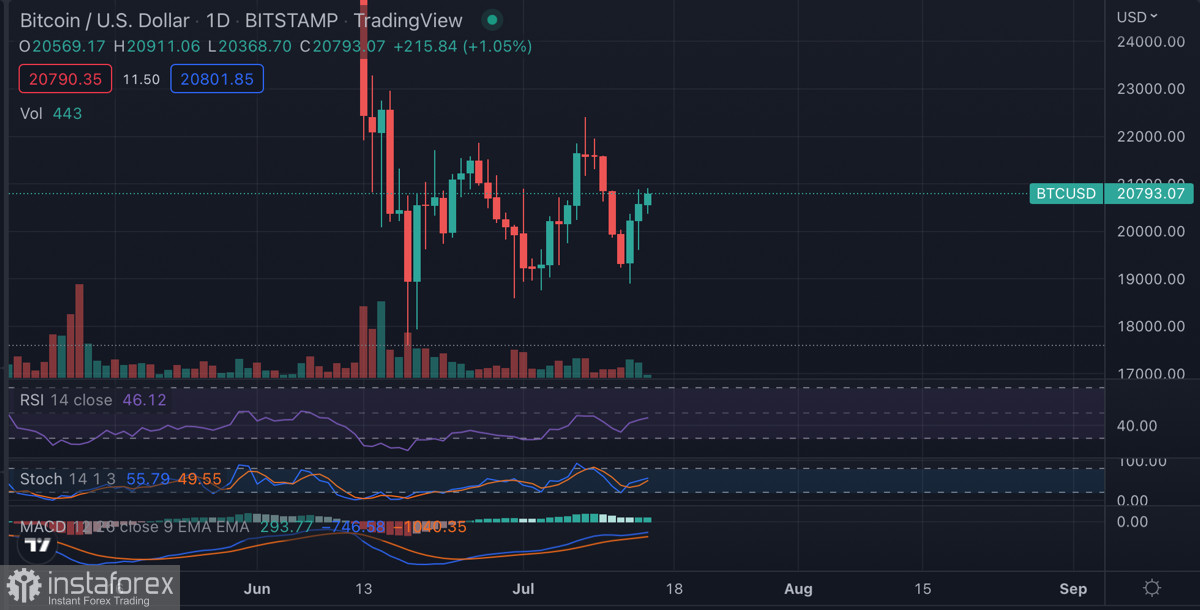
Bitcoin strongly reacted to the US inflation report and tested $19,000. The cryptocurrency gained upward movement and made a number of bullish breakouts. As of July 15, the asset is trading near $20,500 and the next resistance zone will be located at $20,800. The market reacted unexpectedly to the record level of inflation in the US. In a similar scenario, one of the biggest capitulations took place in June. However, the situation changed in July, and there are two explanations for this.
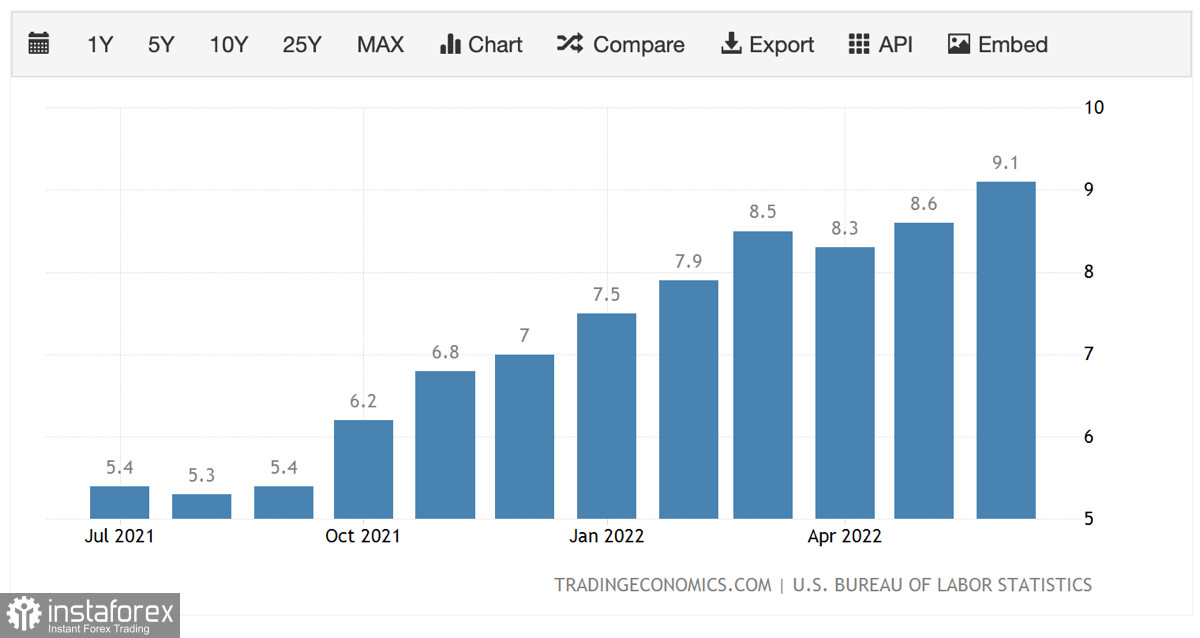
Bitcoin rose despite rising inflation because the market was preparing for it. Over the past three weeks, we have heard speeches about inflation from Fed members, Chairman Powell, and the White House. All of their speeches made similar points about the impossibility of controlling inflation at that time. They also noted that the key rate could be raised by 75 basis points. As of July 15, there are already rumors about the increase of the rate by 1.00% at once. At the same time, the price of BTC is rising. This is due to the market's adaptation to the current geopolitical and economic conditions. Therefore, the inflation rate of around 9% has already been built into the price of the cryptocurrency.
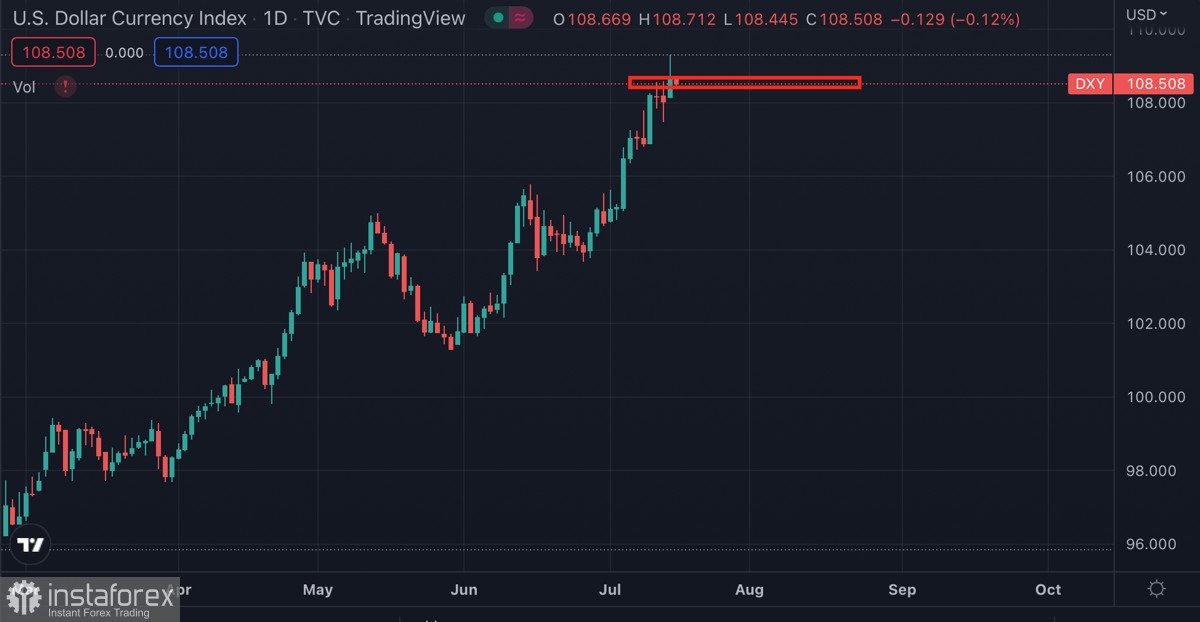
The second reason was the growing US dollar index. The DXY hit a 20-year high during the week due to rising inflation and the Fed's policy. The index hit a swing high of 109 before starting to fall. On July 15, the index is consolidating. Bitcoin has an inverse correlation with DXY, and therefore the temporary flat of the US dollar index gives BTC and other high-risk assets a chance to grow.
The robust uptrend was also possible because of a period of consolidation, which was preceded by an equally bright capitulation of investors of all stripes. As a result, bears have finally exhausted, reaching $17,700, while bulls have accumulated the strength for a bullish rush.
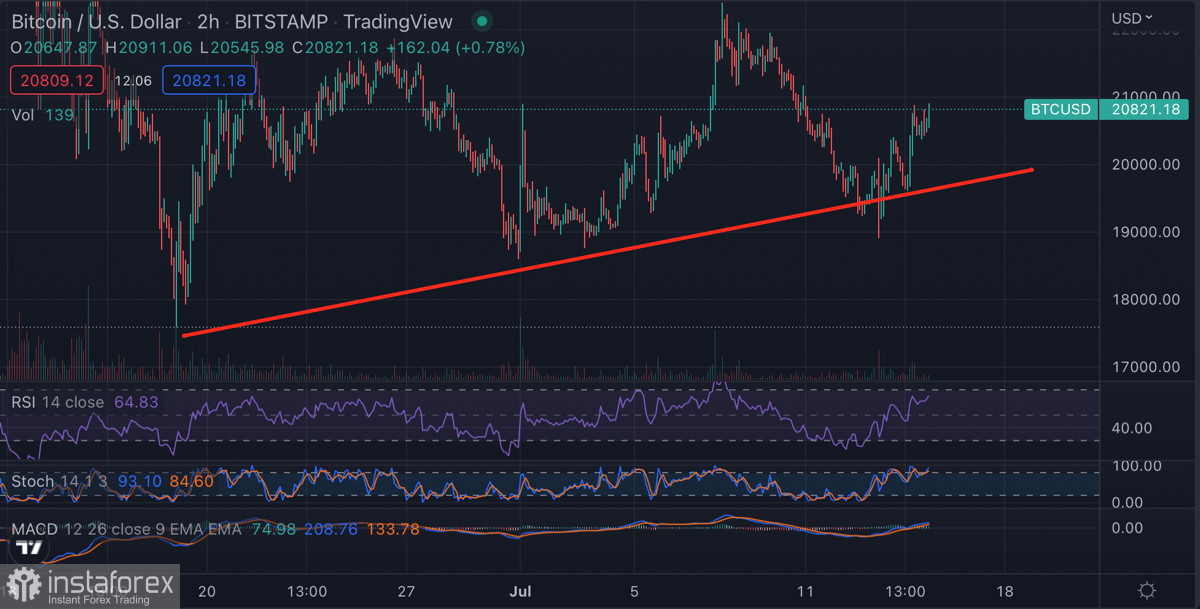
On the two-hour chart, we saw another bounce of the price from the formed support zone, which originates from the moment of formation of the local bottom. Bitcoin made a false breakout of the support zone, but later recovered on relatively high volumes and formed a bullish engulfing pattern.
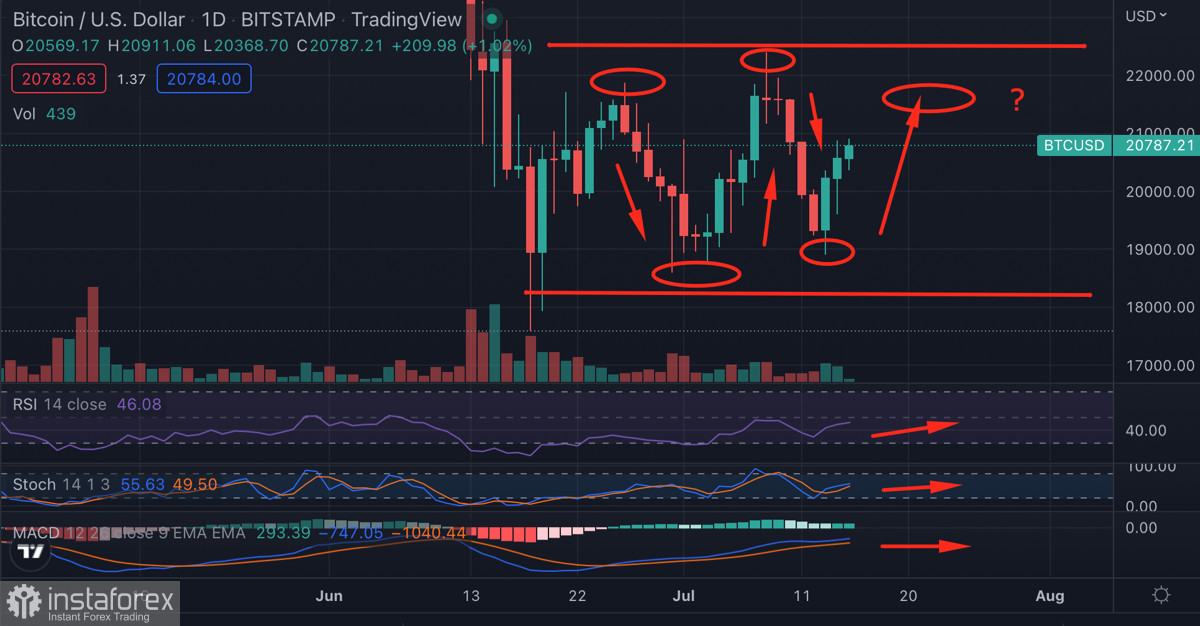
On the daily chart, we see the preconditions for the next retest of the area of $20,800-$21,200. The stochastic oscillator is preparing to form a bullish crossover, and the relative strength index indicates the presence of upward momentum and growing purchases. At the same time, the MACD continues the flat movement with no prerequisites for crossing the zero mark. This suggests that investors are able to make local upward movements, but the longer-term trend lacks the necessary volumes.
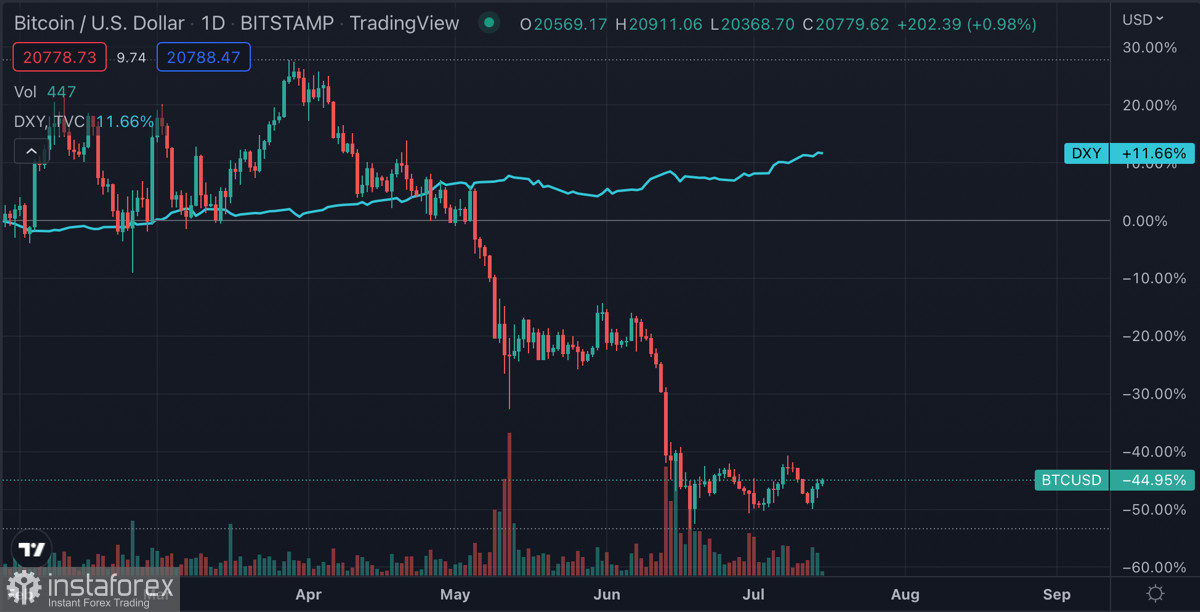
In any case, the cryptocurrency price continues the classic movement and bounces from the boundary of the current trading channel. There are no prerequisites for an upward breakthrough of $22,000 at the moment, as the volumes are still low. Moreover, in the current macroeconomic situation, we see the formation of a macrotrend in the DXY index. Bitcoin has an inverse correlation with this index, which means that until the armed conflict and economic crisis are over, the only signal for a local bullish market for BTC will be a DXY correction.


