


Analysis of Friday's deals:
30M chart of the GBP/USD pair
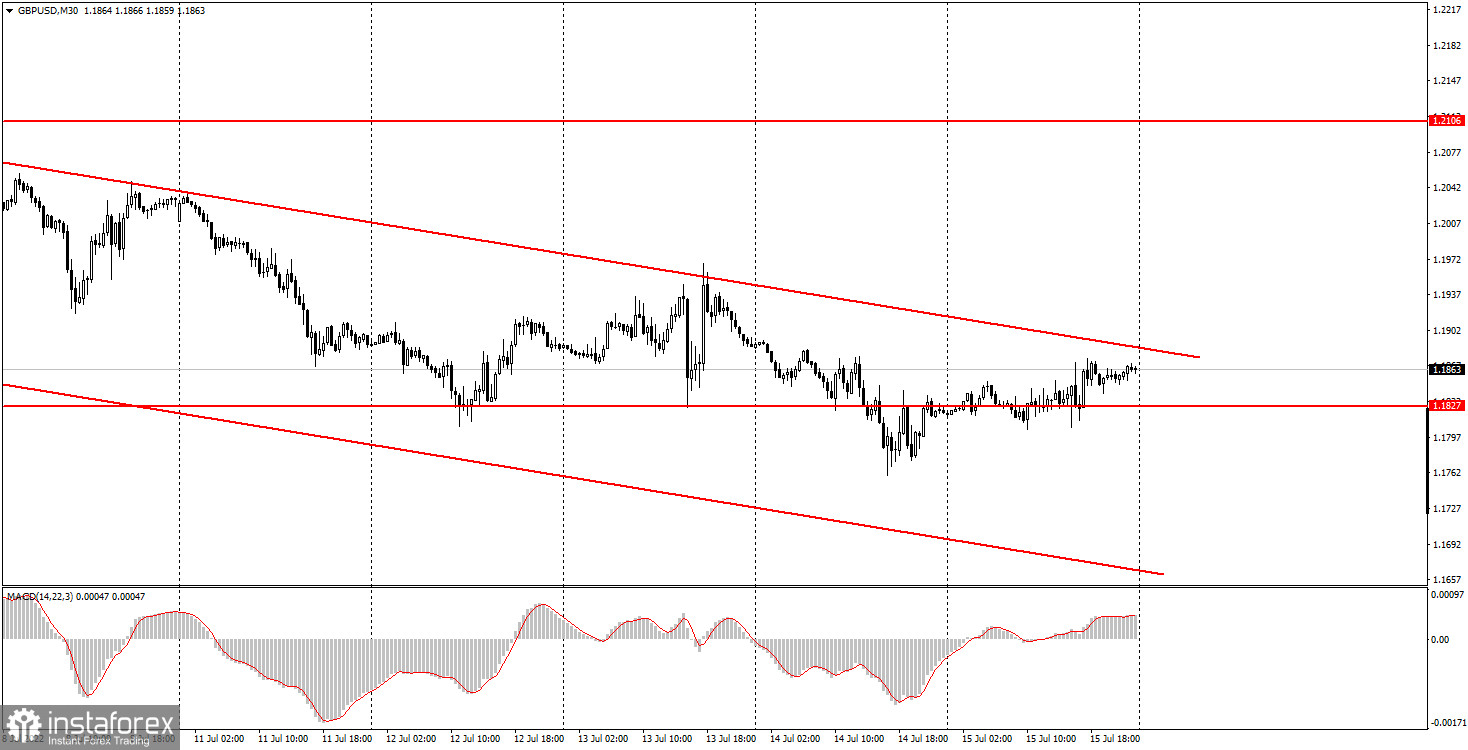
The GBP/USD pair showed an absolutely indistinct movement on Friday. By and large, the price was in a flat or very close to it the entire day, which has not happened for quite a long period of time. A small burst of activity was observed at the beginning of the US trading session, but the volatility of the day was quite low, which, again, has not happened for a very long time. As a result, the pound started an upward correction, but is still within the descending channel, so the downward trend continues. If the price overcomes the upper limit of this channel, then we can talk about the prospects for a more serious growth of the British currency, but there is one very important point here. The pair should leave the channel not in a flat. It is obvious that if the channel is descending and the price is moving sideways, then sooner or later the channel will go below the price itself. It is necessary that it be the other way around: the price must break through the channel and leave it. Otherwise, we will not receive a strong buy signal. There were no important statistics and fundamental events in the UK on Friday. Three reports in the US, which turned out to be offsetting each other, caused a slight market reaction, but it did not affect the general state of affairs.
5M chart of the GBP/USD pair
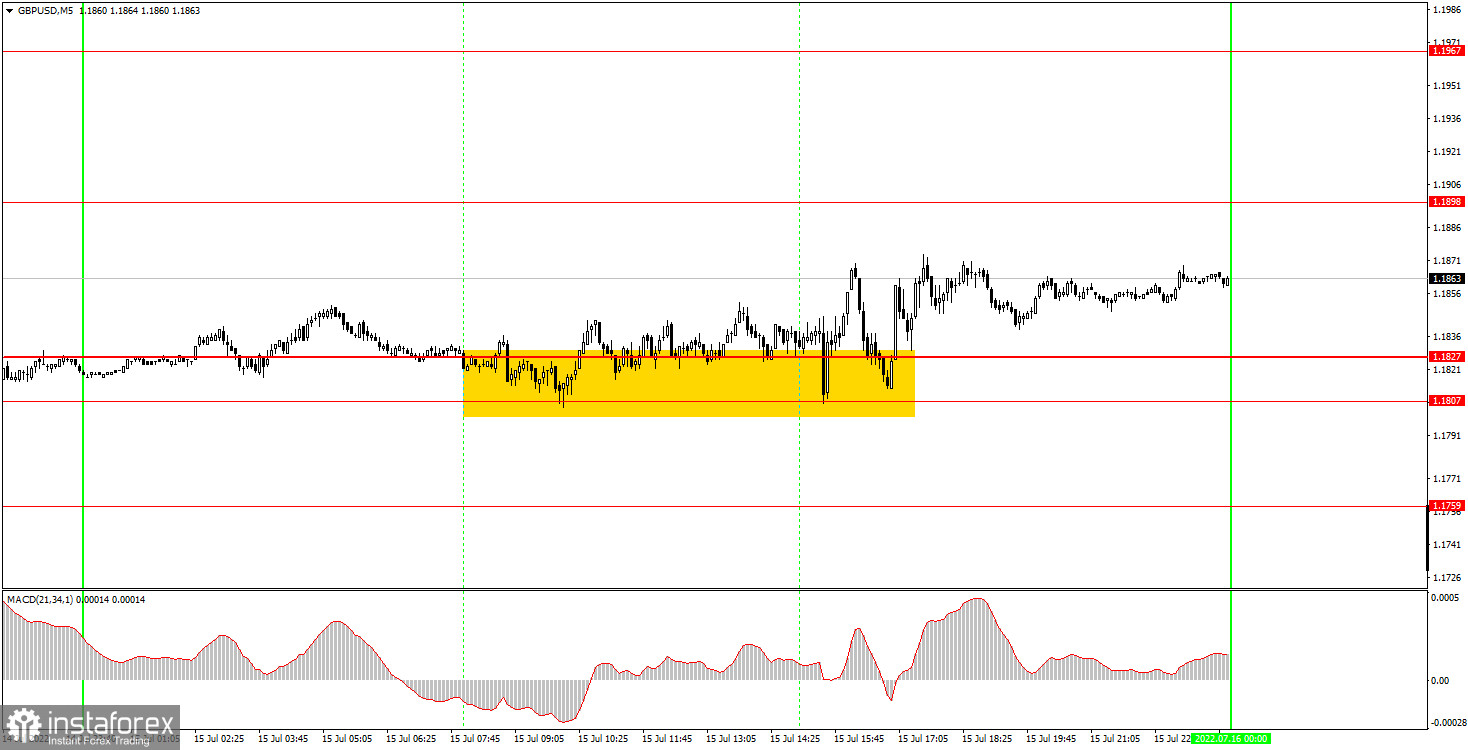
Friday's movements on the 5-minute timeframe were even more telling than on the 30-minute timeframe. By and large, the pair was trading near the 1.1807-1.1827 area for the entire European session, bouncing off it every hour. Therefore, buy signals were scattered. Since the price never settled below the indicated area, the long position (whenever it was opened) should have remained the only deal of the day, and it had to be closed manually in the late afternoon. In this case, you could even earn a few dozen points. But in general, both the movements and the signals on Friday were very complex and confusing. The pound moved away from its 2-year lows with great difficulty, and now, if it wants to continue rising, it needs to be bought by market participants. And we are not seeing much desire among traders to buy the pound or the euro.
How to trade on Monday:
On the 30-minute timeframe, the pair is likely to try to leave the descending channel again next week. If it manages to leave it, not as a result of a flat, this can be considered a signal for a stronger growth. Otherwise, a flat may begin or a downward movement may resume. On the 5-minute TF on Monday, it is recommended to trade at the levels of 1.1759, 1.1807-1.1827, 1.1898, 1.1967. When the price passes after opening a deal in the right direction for 20 points, Stop Loss should be set to breakeven. There are no major reports or other events scheduled for Monday in the UK and America. Volatility dropped sharply on Friday, so on Monday we will see if this is a fluke or not. If the flat and low volatility continue, this will mean that traders will be waiting. In standby mode for meetings of the Federal Reserve and the Bank of England.
Basic rules of the trading system:
1) The signal strength is calculated by the time it took to form the signal (bounce or overcome the level). The less time it took, the stronger the signal.
2) If two or more deals were opened near a certain level based on false signals (which did not trigger Take Profit or the nearest target level), then all subsequent signals from this level should be ignored.
3) In a flat, any pair can form a lot of false signals or not form them at all. But in any case, at the first signs of a flat, it is better to stop trading.
4) Trade deals are opened in the time period between the beginning of the European session and until the middle of the American one, when all deals must be closed manually.
5) On the 30-minute TF, using signals from the MACD indicator, you can trade only if there is good volatility and a trend, which is confirmed by a trend line or a trend channel.
6) If two levels are located too close to each other (from 5 to 15 points), then they should be considered as an area of support or resistance.
On the chart:
Support and Resistance Levels are the Levels that serve as targets when buying or selling the pair. You can place Take Profit near these levels.
Red lines are the channels or trend lines that display the current trend and show in which direction it is better to trade now.
The MACD indicator (14,22,3) consists of a histogram and a signal line. When they cross, this is a signal to enter the market. It is recommended to use this indicator in combination with trend lines (channels and trend lines).
Important speeches and reports (always contained in the news calendar) can greatly influence the movement of a currency pair. Therefore, during their exit, it is recommended to trade as carefully as possible or exit the market in order to avoid a sharp price reversal against the previous movement.
Beginners on Forex should remember that not every single trade has to be profitable. The development of a clear strategy and money management are the key to success in trading over a long period of time.


