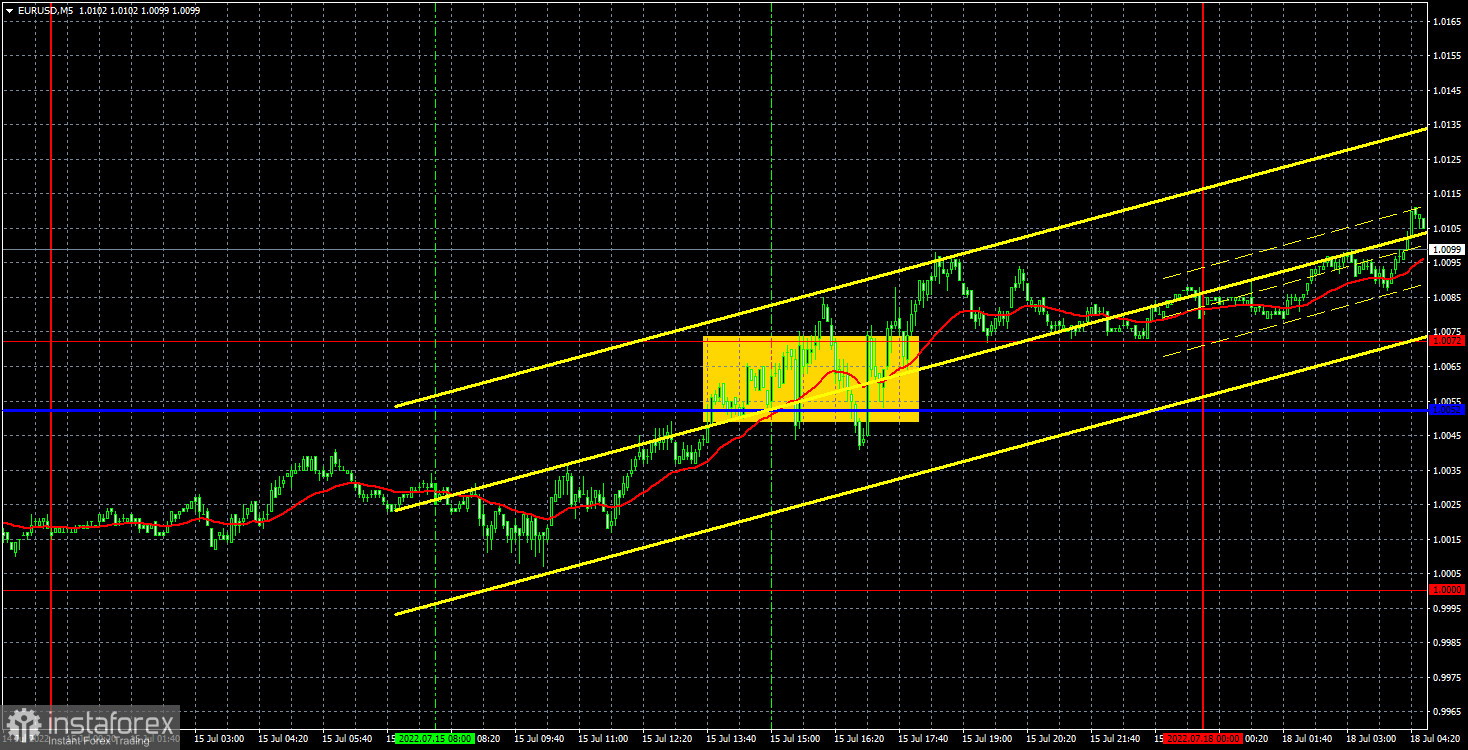
M5 chart of EUR/USD

On Friday, the EUR/USD pair started to retrace upward. At the moment, the euro is near the previous swing low, which has not been updated or broken yet. So, the downtrend may resume to the 20-year low. On Friday, macro data in the US triggered a mixed reaction in the market. Still, it is early to talk about the end of the long-term downtrend or the beginning of an upward correction. The ECB governing council meeting will take place this week, and the FOMC meeting will be held next week. Fundamental factors are still weighing on the euro. A possible 0.25% rate increase by the ECB is unlikely to support the euro amid the anticipated 0.75% rate hike by the Fed.
There were a few trading signals on Friday. At the beginning of the North American session, the price entered the 1.0052-1.0072 range and hovered there for several hours. Market jitters were triggered by the release of macro data in the US (industrial production, retail sales, and consumer sentiment). Overall, those figures had no effect on both the intraday trend and the general trend whatsoever. Trading signals were made almost at the close of the trading day. So, opening trades a few hours before the close of the market was risky.
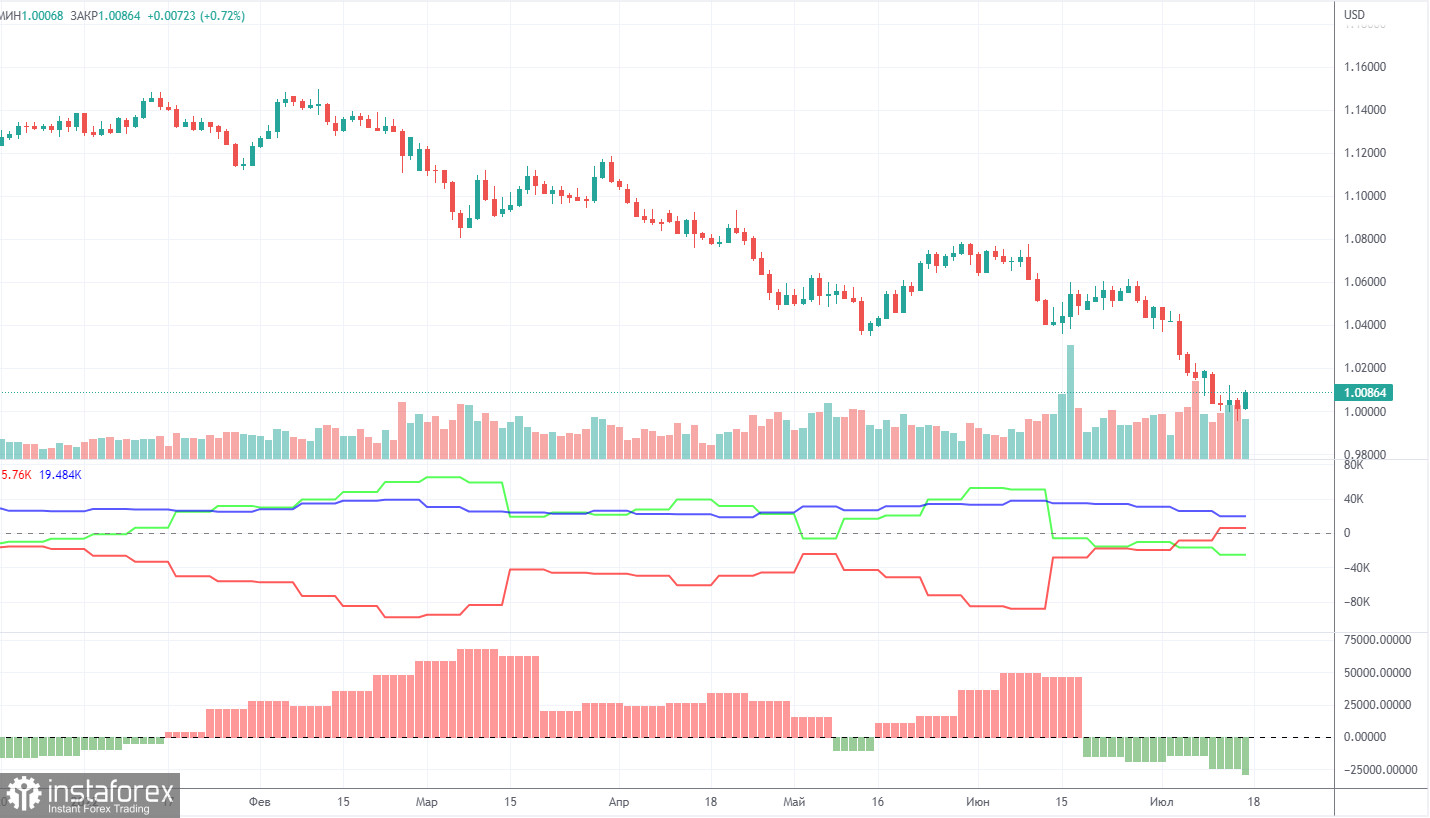
COT report:

COT reports for the past six months are raising doubts because they show bullish sentiment, while the euro is bearish. The situation has now somewhat changed for the worse as sentiment has turned bearish, while the euro is still bearish. Therefore, the uptrend is highly unlikely any time soon. During the reporting week, the number of long positions increased by 100 and the number of short positions rose by 8.5K. Accordingly, the net position decreased by almost 8.5K. The sentiment of non-commercial traders remains bearish and has been even getting stronger in recent weeks. This means that non-commercial traders are unlikely to buy the euro in the near future. The number of long positions held by non-commercial traders is now 25K less than that of short ones. So, demand for the dollar is still high, which could exert additional pressure on the euro. All in all, the euro was unable to show a noticeable correction in the past few months. Its biggest upward movement was about 400 pips.
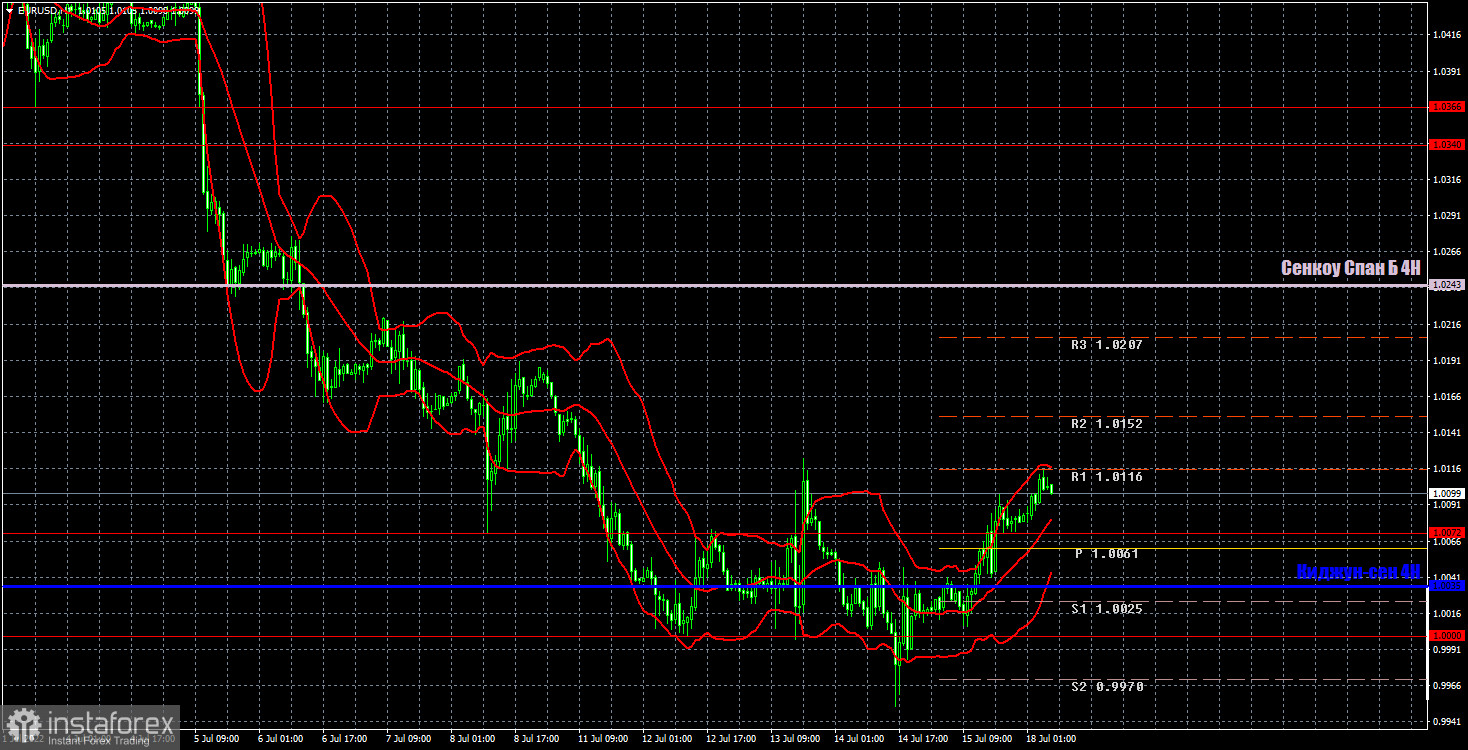
H1 chart of EUR/USD

In the H1 time frame, the trend is still bearish. Should the pair break through the swing high of 1.0123, the euro will rise. Although it may well be another corrective move upward. Neither fundamental nor geopolitical background now signals to buy the pair. On Monday, trading levels are seen at 1,.0000, 1.0072, 1.0340-1.0366, 1.0485, 1.0243 (Senkou Span B), and 1.0035 (Kijun-sen). Ichimoku indicator lines can move during the day, which should be taken into account when determining trading signals. However, there have been no signals produced near support and resistance. Signals are made whenever the price bounces or breaks through extreme levels. Don't forget to place a stop-loss order at the breakeven point when the price passes 15 pips in the right direction. It can help you minimize losses when a signal turns out to be false. On July 18, the macroeconomic calendar is empty both in the eurozone and the US. Therefore, volatility may somewhat decrease today, and the pair may extend a correction or consolidate in the range.
Indicators on charts:
Resistance and support are thick red lines, near which the trend may stop. They do not make trading signals.
The Kijun-sen and Senkou Span B lines are the Ichimoku indicator lines moved to the hourly timeframe from the 4-hour timeframe. They are also strong lines.
Extreme levels are thin red lines, from which the price used to bounce earlier. They can produce trading signals.
Yellow lines are trend lines, trend channels, and any other technical patterns.
Indicator 1 on the COT chart shoe the size of the net position of each trader category.
Indicator 2 on the COT chart reflects the size of the net position for the Non-commercial group of traders.


