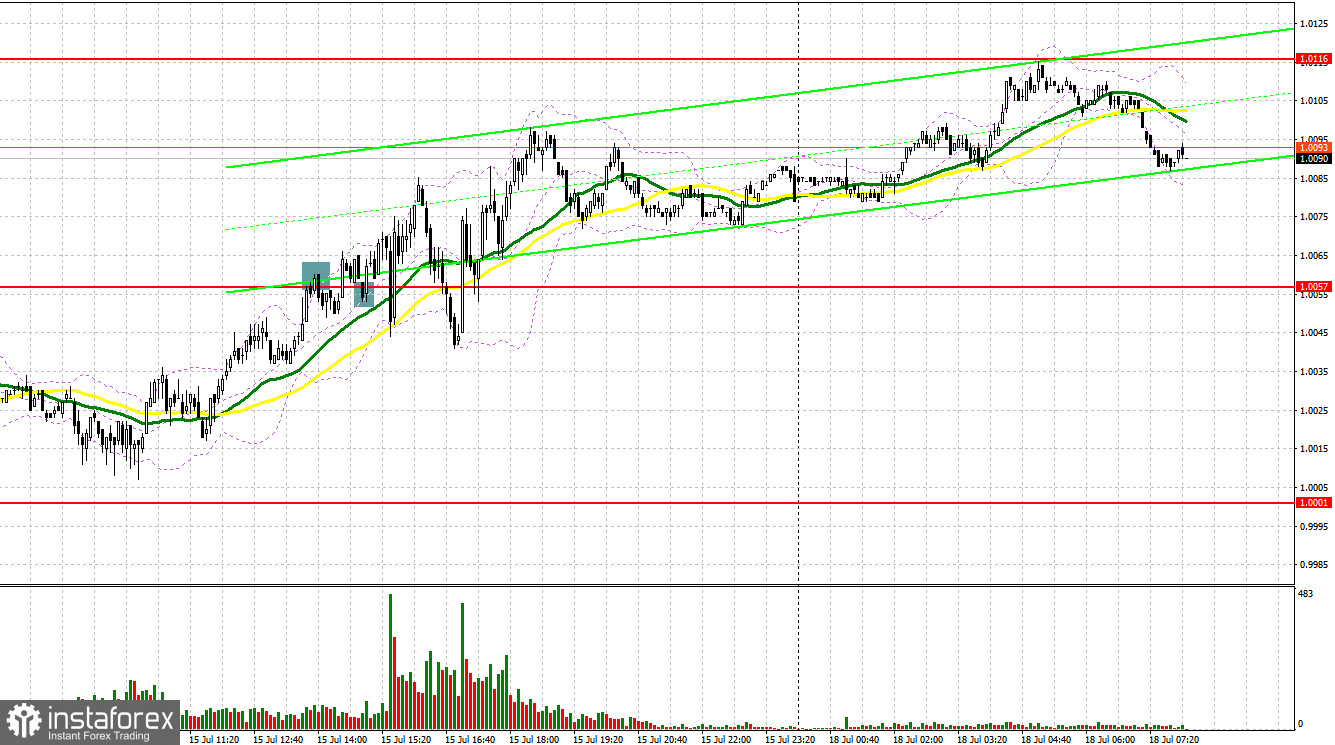
Friday was not the most efficient trading day. Let's look at the 5-minute chart and try to figure out what actually happened. EUR/USD made a minor decline which looks like an attempt of the euro traders to push EUR down in the first half of the day. The currency pair did not touch 1.0000. Therefore, I didn't find out any false breakout there. In turn, I wasn't able to enter the market with long positions. In the course of the New York session, the bears managed to defend 1.0057. It seemed there was an excellent market entry point for sell positions following the overall downtrend. However, the price didn't make a notable down move. In practice, 1.0057 was broken and tested downwards in mid-day. This price action enabled me to exit short positions and open long ones. The price moved 30 pips upward.

What is needed to open long positions on EUR/USD
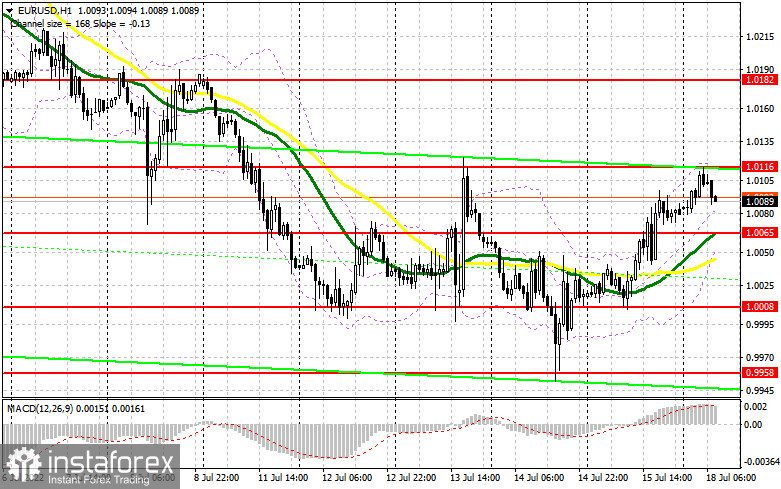
EUR had an upward correction as expected. Nevertheless, further growth raises doubts. Currently, EUR/USD is trading at about important resistance at 1.0116 which also acts as the upper border of the wide trading range where the price got stuck at the end of the last week. To develop a steady bullish market, the pair needs to break 1.0116 and, more importantly, defend 1.0065. I would advise you to focus on this level to make trading decisions. The economic calendar lacks any statistics in the first half of the day that could influence market sentiment. Thus, the buyers could grasp their chance.
In case the trading instrument goes down, the bulls will have to protect the nearest support of 1.0065. Moving averages are passing a bit lower in favor of the buyers. After a false breakout there, we could assume a new jump as we saw on Friday. The nearest target is seen at the resistance of 1.0116. If broken and tested downwards, this will trigger stop losses of the sellers. We will also see a signal for opening long positions, reckoning a larger growth towards 1.0182. Still, it is too early to predict a large upward correction under such market conditions. 1.0271serves as the most distant target where I recommend profit taking. In case EUR/USD declines and the buyers don't open positions at 1.0065, which is highly probable under a low trade volume, EUR will come under strong pressure. In this case, I wouldn't recommend entering the market. It would be reasonable to open long positions following a false breakout at 1.0008. It would make sense to buy EUR/USD immediately at a dip from 0.9958 or lower at 0.9915, bearing in mind an upward intraday correction of 30-35 pips.
What is needed to open short positions on EUR/USD
On Friday, the bears loosened their grip on EUR/USD. While the pair is trading below 1.0116, the price will remain in the trading range. This will reinforce the chance of a further drop in line with the trend. In case EUR/USD grows in the first half of the day amid the empty economic calendar, a false breakout at the nearest resistance at 1.0116 will generate a signal for opening short positions on the assumption EUR/USD's decline to the middle of the sideways range at 1.0065.
A breakout and consolidation below this range as well as the test upwards will create an extrasell signal that will trigger the buyers' stop losses. The price could develop a strong move towards the powerful support of the last week at 1.0008. A breakout and consolidation below this area will open the way to 0.9958 where I recommend closing sell positions in full. 0.9915 is a more distant target. In case EUR/USD goes up in the European session, and the bears lack activity at 1.0116,the sellers might face serious problems because a smooth price reversal from the parity level, which is clearly observed on the 1-hour chart, could push the pair sharply up. Under such a scenario, I recommend opening short positions until more attractive resistance at 1.0182 where moving averages are passing. The thing is that a strong breakout there will become a new market entry point for short positions. We could sell EUR/USD at a bounce off 1.0271 or higher at 1.0341, bearing in mind a downward correction of 30-35 pips.

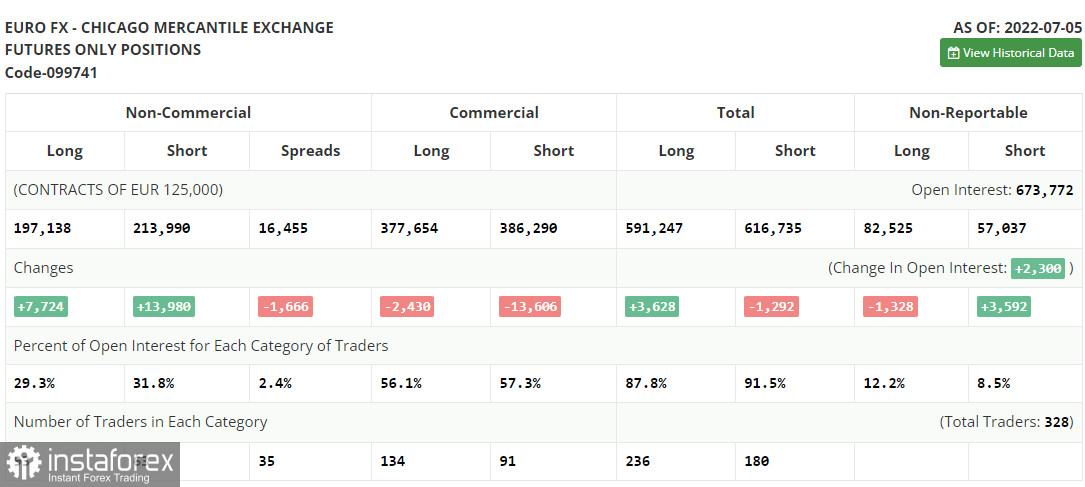
The COT (Commitment of Traders) report from July 5 indicates growth in both long and short positions. Short positions were twice more numerous than long ones. It means the overall bearishsentiment in the market formed a bigger negative delta. Last week, the EU retail sales data discouraged investors. In contrast, the US data on the labor market indicated that the Federal Reserve would be poised to pursue extremely hawkish monetary policy as a measure against high inflation. The market also was alert to remarks from ECB President Christine Lagarde who advocated for raising interest rates with the aim of curbing inflation. The highlight of the week isthe US inflation report that might again log another spike. If the actual data matches the forecast, don't be surprised about a further advance of the US dollar against the euro and the party level.
According to the COT report, long non-commercial positions increased by 7,724 to 197,138whereas short non-commercial positions grew by 13,980 to 213,990. Despite the low exchange rate of EUR, traders prefer to buy USD because of the prospects of aggressive tightening by major central banks and a recession in many developed economies. As a result, the overall non-commercial net positions remained negative and came in at -16,852 against -10,569 earlier. The currency pair closed lower on Friday at 1.0316 against 1.0584 a week ago.

Indicators' signals:The currency pair is trading above the 30 and 50 daily moving averages. It indicates that EUR/USD is making attempts to push ahead with the upward correction.
Moving averages
Note: The period and prices of moving averages are considered by the author on the H1 hourly chart and differ from the general definition of the classic daily moving averages on the daily D1 chart.
Bollinger BandsIf EUR/USD declines, the indicator's lower border at 1.0055 will serve as support. Otherwise,if the currency pair grows, the upper border at nearly 1.0116 will serve as resistance.
Description of indicators
Moving average (moving average, determines the current trend by smoothing out volatility and noise). Period 50. It is marked yellow on the chart.
Moving average (moving average, determines the current trend by smoothing out volatility and noise). Period 30. It is marked green on the chart.
MACD indicator (Moving Average Convergence/Divergence — convergence/divergence of moving averages) Quick EMA period 12. Slow EMA period to 26. SMA period 9
Bollinger Bands (Bollinger Bands). Period 20
Non-commercial speculative traders, such as individual traders, hedge funds, and large institutions that use the futures market for speculative purposes and meet certain requirements.
Long non-commercial positions represent the total long open position of non-commercial traders.
Short non-commercial positions represent the total short open position of non-commercial traders.
Total non-commercial net position is the difference between short and long positions of non-commercial traders.


