


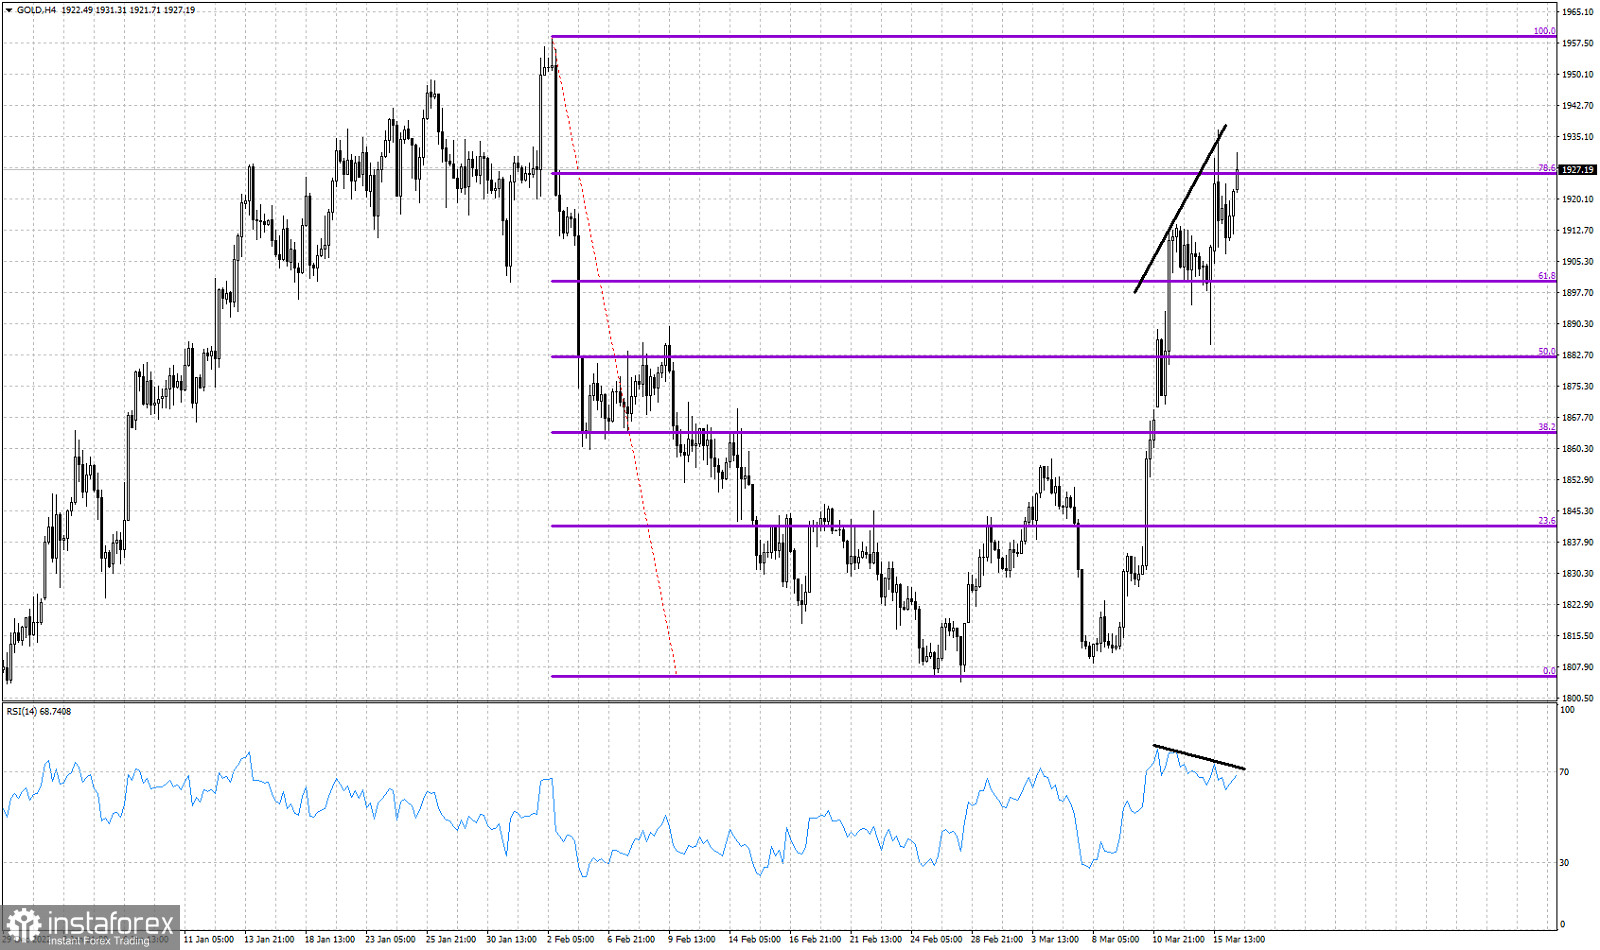
Violet lines- Fibonacci retracement levels
Black lines- bearish RSI divergence
Gold price is trading around $1,930 after making a pull back towards $1,907. Price is very close to making a new higher high. Short-term trend remains bullish. There is no sign of a reversal, but there is an important warning sign for bulls. The RSI is providing bearish divergence signals. The RSI continues making lower highs. There are increased chances that a new high in price will be followed by a third lower high in the RSI. This is a sign of a weakening up trend and a reversal can follow very soon. Yesterday's low around $1,907 is now key short-term support. A break below this level would be our first sign of a reversal.


