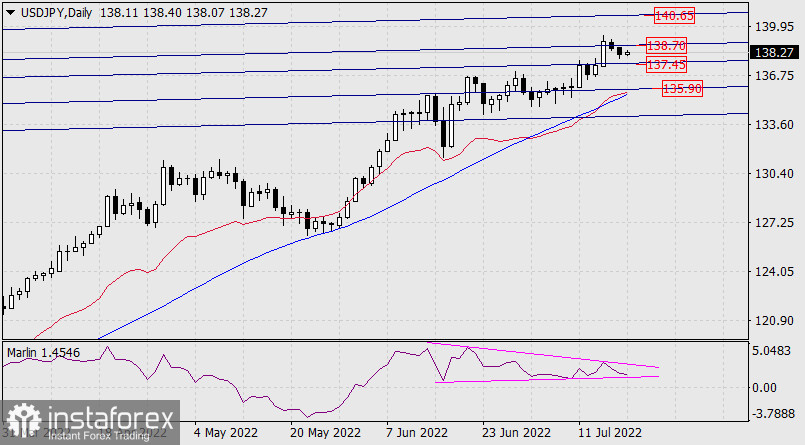
In the last two sessions, the USD/JPY pair has been declining in the range of two embedded lines of the rising channel of the monthly timeframe. At the moment, this range is defined by price marks 137.45 and 138.70. The decline was corrective.

Naturally, if the price breaks above the upper line at 138.70, it will open the target at 140.65, and if it goes below the lower line (alternative scenario), it will open the target at 135.90, which is already approaching the daily MACD line.
The signal line of the Marlin Oscillator is developing in a wedge-shaped formation, which also creates an advantage for the growing scenario.

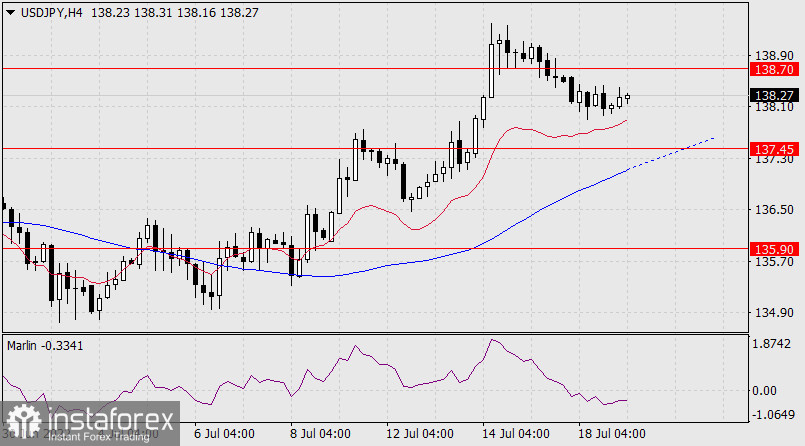
The price develops above the balance and MACD indicator lines on the H4 chart. The Marlin Oscillator is turning up with the intention of moving into an upward trend zone and helping the price develop a bullish attack.


