


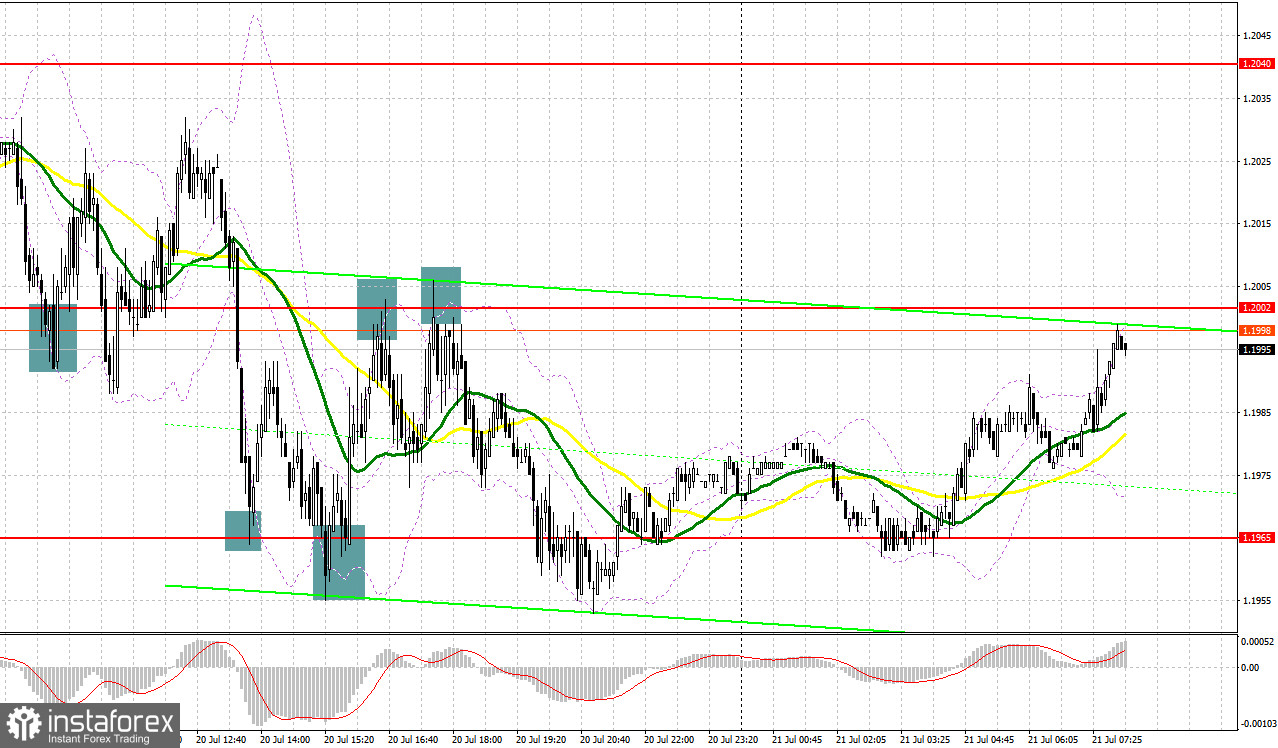
Yesterday, we got several good signals to enter the market. Let's look at the 5-minute chart and see what happened there. In my morning review, I mentioned the level of 1.2002 as a good point to enter the market. A decline in the pound after the publication of the CPI data and a false breakout of 1.2002 formed a good buy signal. As a result, the pair went up by nearly 30 pips but then it stopped. A retest of the 1.2002 level ended in a breakout and a sharp fall of the pair towards 1.1965. A similar break at this point created another good signal for going long. So, the total upside movement was about 40 pips. Several false breakouts at 1.2002 formed a good entry point to sell the pound intraday, considering the continuation of the downward correction. This resulted in a sell-off of more than 50 pips.
For long positions on GBP/USD:
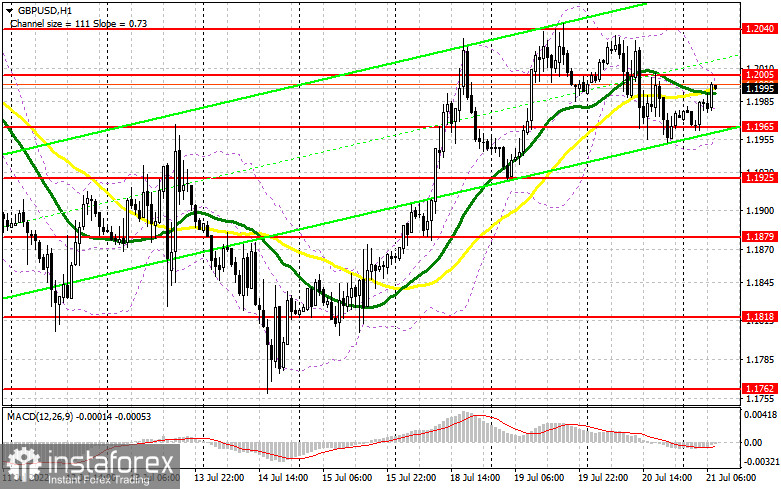
Yesterday's report on inflation in the UK had a limited impact on the pound as the actual reading did not exceed the forecast much. Therefore, it is unlikely to influence the plan of the Bank of England to raise the rate next month. Apparently, inflation in the UK has reached a new 40-year high in June which will make life in the country even more expensive. Consumer prices rose by 9.4% from the previous year which is the largest increase since 1982. According to UK Office for National Statistics, fuel prices rose the most, posting a 9.3% increase last month. Today, nothing important is expected in the first half of the day, so the pound bulls have a good chance of returning the price to weekly highs. The best scenario to buy the pound would be to wait for a downward correction to the nearest support at 1.1965. Yesterday, this level proved to be strong support for the bulls as it did not allow the triggering of stop-loss orders set below. A false breakout of this level will generate a signal for opening long positions with the target found at the interim support of 1.2005. Its breakout will pave the way towards the weekly high of 1.2040. If broken and tested downwards, strong upside momentum will be generated at this level. This will serve as a buy signal that will initiate a jump in the price and a retest of 1.2081. A similar break of this level will open the way to 1.2119 where I recommend profit taking. The level of 1.2160 will act as the next upward target. If GBP/USD falls and buyers don't open any new positions at 1.1965, the downward pressure on the pound will considerably increase. If so, I would advise you to wait until the price hits the level of 1.1925. Buying at this point should be done only after a false breakout. Long positions on GBP/USD can be opened right after a rebound from 1.1879, or even lower from 1.1818, considering a correction of 30-35 pips within the day.
For short positions on GBP/USD:
Bears did well yesterday and defended the weekly high, thus preventing the bulls from developing a further upside correction. Today, they will need to keep the bulls below the 1.2005 level. Otherwise, the buyers will be back in control. It is better to open short positions after a false breakout of 1.2005 similar to the scenario I described above. In this case, the pair will be again under pressure, and the price may decline to the key support level of 1.1965. Then the situation will depend on the bulls. If their activity is low at this level, and the price settles below it, an upward retest will create another good point to sell the pound with the target at 1.1925. This is where I recommend partial profit taking. The area of 1.1879 will act as a more distant target. If GBP/USD continues to rise, and bears don't open any new positions at 1.2005 in the first half of the day, bulls will regain control of the market. In this case, I wouldn't recommend selling the pair. A false breakout of the weekly high of 1.2040 will create an entry point for going short, considering a downside pullback of the pair. If nothing happens there as well, the price may surge to the upside. If so, open short positions only when the price reaches 1.2080 and 1.2119. Here you can sell GBP/USD right after a rebound, keeping in mind a possible downside intraday pullback of 30-35 pips.
COT report
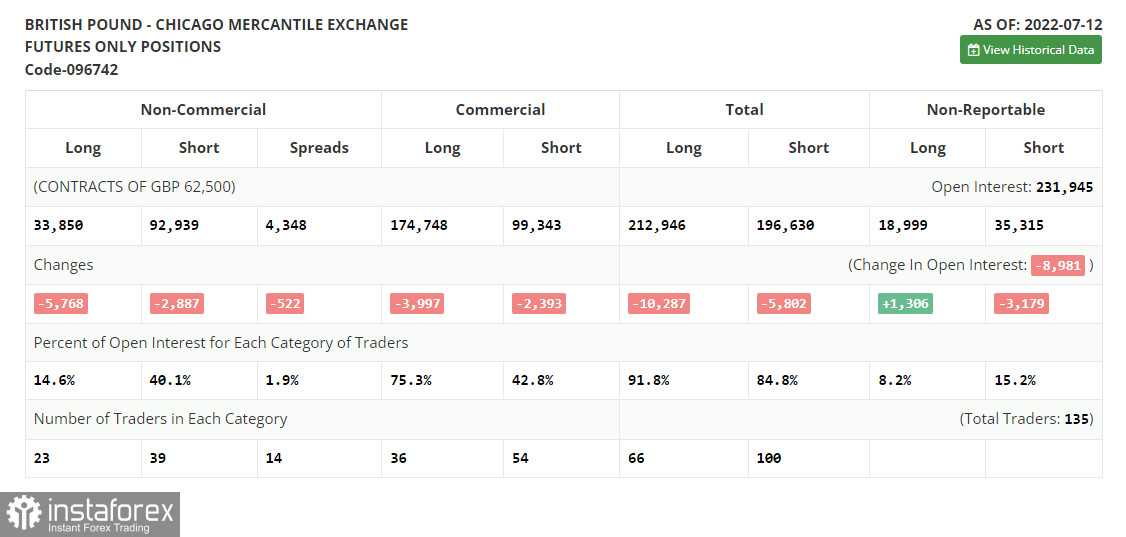
The COT (Commitment of Traders) report for July 12 showed a decline in both short and long positions. However, the short ones prevailed which led to an increase in the negative delta. Another attempt to buy the pair at yearly lows failed although traders started to take profit at the end of the week, encouraged by the strong macroeconomic data from the US. This resulted in a slight correction in the pound which has been developing for some time already. The cost of living crisis in the UK is getting more acute every day, and the government is struggling to cope with it. At the same time, the Fed's policy and the pace of monetary tightening in the US provide significant support to the US dollar and put more pressure on the pound. The US regulator is expected to raise the rate straight by 1.0% next time. According to the COT report, long positions of the non-commercial group of traders decreased by 5,768 to 33,850, while short positions declined by 2,887 to 92,939. As a result, the negative non-commercial net position increased to -59,089 from -56,208. The weekly closing price declined to 1.1915 from 1.1965.
Indicator signals:
Moving Averages
Trading near the 30 and 50-day moving averages indicates that the market is moving sideways.
Please note that the time period and levels of the moving averages are analyzed only for the H1 chart, which differs from the general definition of the classic daily moving averages on the D1 chart.
Bollinger Bands
In case of an uptrend, the level of 1.2005 will serve as resistance. If the pair declines, the lower band at 1.1965 will act as support.
Description of indicators:
• A moving average of a 50-day period determines the current trend by smoothing volatility and noise; marked in yellow on the chart;• A moving average of a 30-day period determines the current trend by smoothing volatility and noise; marked in green on the chart;• MACD Indicator (Moving Average Convergence/Divergence) Fast EMA with a 12-day period; Slow EMA with a 26-day period. SMA with a 9-day period;• Bollinger Bands: 20-day period;• Non-commercial traders are speculators such as individual traders, hedge funds, and large institutions who use the futures market for speculative purposes and meet certain requirements;• Long non-commercial positions represent the total number of long positions opened by non-commercial traders;• Short non-commercial positions represent the total number of short positions opened by non-commercial traders;• The total non-commercial net position is the difference between short and long positions of non-commercial traders


