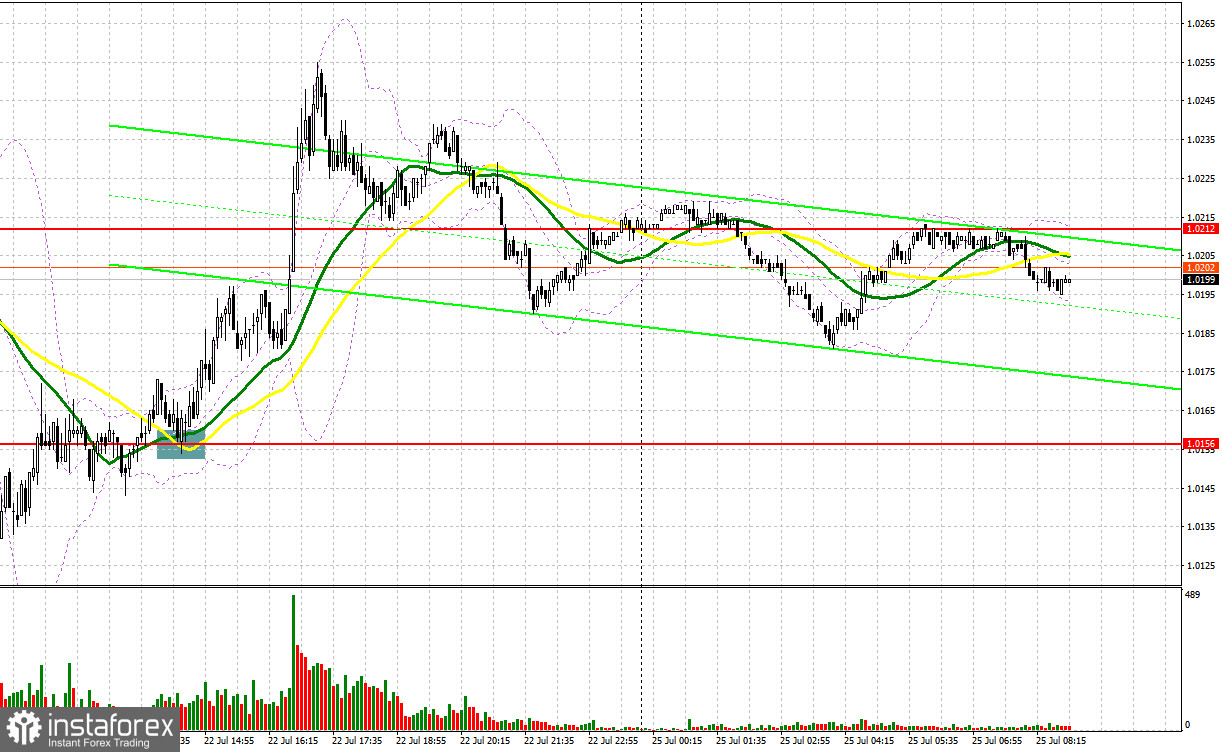
There was only one signal to enter the market on Friday. Let's look at the 5-minute chart and see what happened there. Buyers managed to defend the lower boundary of the sideways channel and showed their strength at the level of 1.0157 that I pointed out in my morning review. Downbeat data from the eurozone caused a steep decline in the euro against the US dollar. As a result, the pair broke through the support of 1.0157. However, bulls began to open long positions at the daily low and brought the price back to this range which generated a buy signal. The pair rose by more than 100 pips but then went through a correction by the end of the day.

For long positions on EUR/USD:
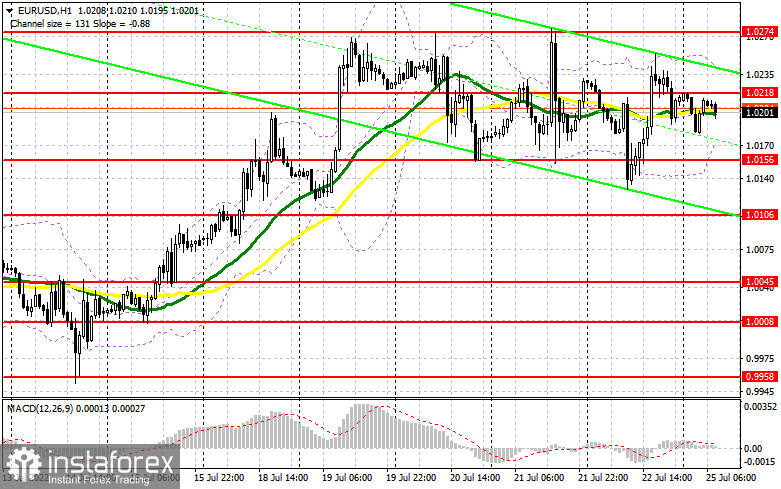
Today's trading session is expected to be calm as no important macroeconomic data is due to be published. Traders are preparing for the 2-day meeting of the US Federal Reserve the results of which will be declared on Wednesday. Today, traders may consider the data on the German Ifo business climate index, business expectations, and current assessment. At this point, volatility may increase. If the results turn out to be below the forecast, the pair will slide to Friday's support of 1.0156. This will be the fourth time when the pair tests this level. Therefore, a new upside movement is possible only after a false breakout of this level. This will form the uptrend up to the interim resistance of 1.0218. A breakout and a downward test of this range will trigger stop-loss orders and generate a signal to open long positions with the upward target at 1.0274. This will be a decisive moment. The level of 1.0321 will serve as the furthest target where I recommend profit taking. If EUR/USD declines and bulls are idle at 1.0156, the pair will come under more pressure as the uptrend will be fully canceled, and bears will leave the sideways channel. In this case, I wouldn't recommend entering the market. It will be better to open long positions after a false breakout at 1.0106. Buying EUR/USD right after a rebound is possible only from the level of 1.0045, or even lower from 1.0008, keeping in mind an upside correction of 30-35 pips within the day.
For short positions on EUR/USD:
After EUR/USD's sharp rise on Friday, bears regained control of the market later in the afternoon and stopped the price from hitting weekly highs. This indicates a balance in the market ahead of the Fed's meeting. The euro/dollar pair is likely to stay in a wide sideways channel of 1.0156-1.0274 in the next few days. In case the euro moves up after the publication of the IFO data, bears will need to protect the nearest resistance of 1.0218. They will also need to prevent the pair from retesting the previous week's high of 1.0274. Otherwise, all their efforts to form a downtrend will be in vain. A false breakout of 1.0218 will create a good signal for opening short positions with the downward target located at 1.0156. A breakout of this level and consolidation below it, as well as its upward retest, will generate an additional signal to sell the euro. This will trigger stop-loss orders set by the bulls and may result in a strong movement towards 1.0106. If the price breaks through this level and settles below it, this will pave the way towards 1.0045. I would recommend closing short positions at this point. The level of 1.0008 will serve as a more distant target. If EUR/USD rises in the European session, and bears are idle at 1.0218, I would advise you to wait until the price hits the resistance of 1.0274. The formation of a false breakout will be a good moment to open short positions. You can sell EUR/USD right after its rebound from the high of 1.0321, or even higher from 1.0374, keeping in mind a possible downward correction of 30-35 pips within the day.

COT report
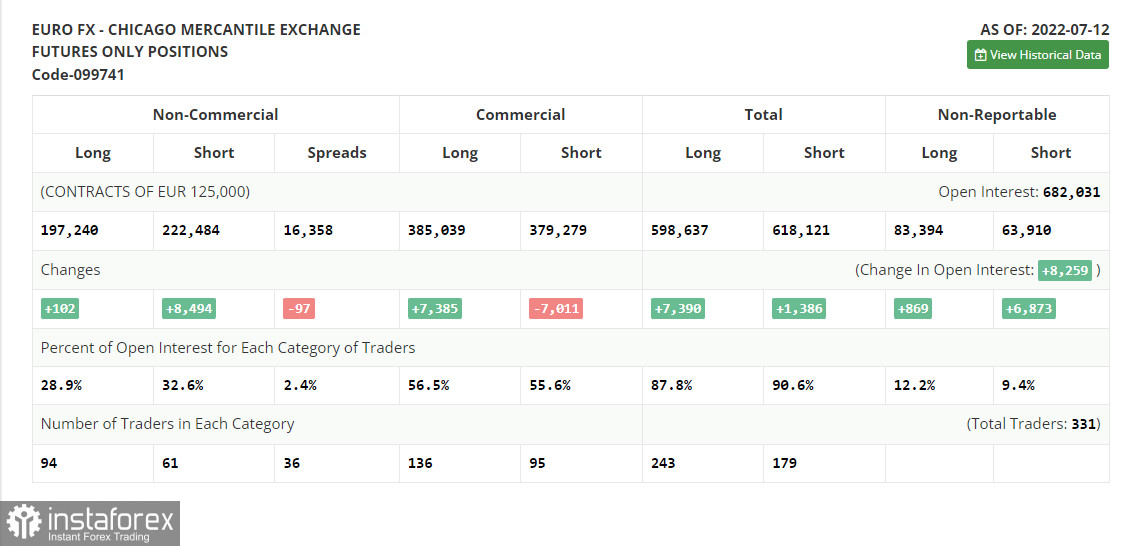
The Commitment of Traders (COT) report for July 12 showed that both long and short positions increased, although the short ones prevailed, indicating a bearish market sentiment. This also resulted in the formation of a large negative delta as the demand for the euro is weak even at the current lows. Strong macroeconomic data from the US showed a rise in both inflation and retail sales which served as a bullish factor for the US currency and a limiting factor for risk assets. As long as the Fed keeps raising the rate, the US dollar will strengthen. In the eurozone, an important report on inflation is coming which may reveal another sharp increase in consumer prices. If so, a slight upside correction is possible. Yet, it may not prevent the euro from another decline and a retest of the parity level. According to the COT report, long positions of the non-commercial group of traders rose by just 102 to 192,240, while short positions jumped by 8,494 to 222,484. Despite a cheap euro, traders prefer to buy the US dollar amid monetary tightening by central banks and the threat of a recession. At the end of the week, the total non-commercial net position remained negative and stood at -25,244 versus -16,852. The weekly closing price declined to 1.0094 from 1.0316.

Indicator signals:
Moving Averages
Trading near the 30 and 50-day moving averages indicates market uncertainty.
Please note that the time period and levels of the moving averages are analyzed only for the H1 chart, which differs from the general definition of the classic daily moving averages on the D1 chart.
Bollinger Bands
In case of a decline, the lower band of the indicator at 1.0175 will serve as support. If the pair moves up, the upper band at 1.0255 will act as resistance.
Description of indicators:
• A moving average of a 50-day period determines the current trend by smoothing volatility and noise; marked in yellow on the chart;
• A moving average of a 30-day period determines the current trend by smoothing volatility and noise; marked in green on the chart;
• MACD Indicator (Moving Average Convergence/Divergence) Fast EMA with a 12-day period; Slow EMA with a 26-day period. SMA with a 9-day period;
• Bollinger Bands: 20-day period;• Non-commercial traders are speculators such as individual traders, hedge funds, and large institutions who use the futures market for speculative purposes and meet certain requirements;
• Long non-commercial positions represent the total number of long positions opened by non-commercial traders;
• Short non-commercial positions represent the total number of short positions opened by non-commercial traders;
• The total non-commercial net position is the difference between short and long positions of non-commercial traders.


