


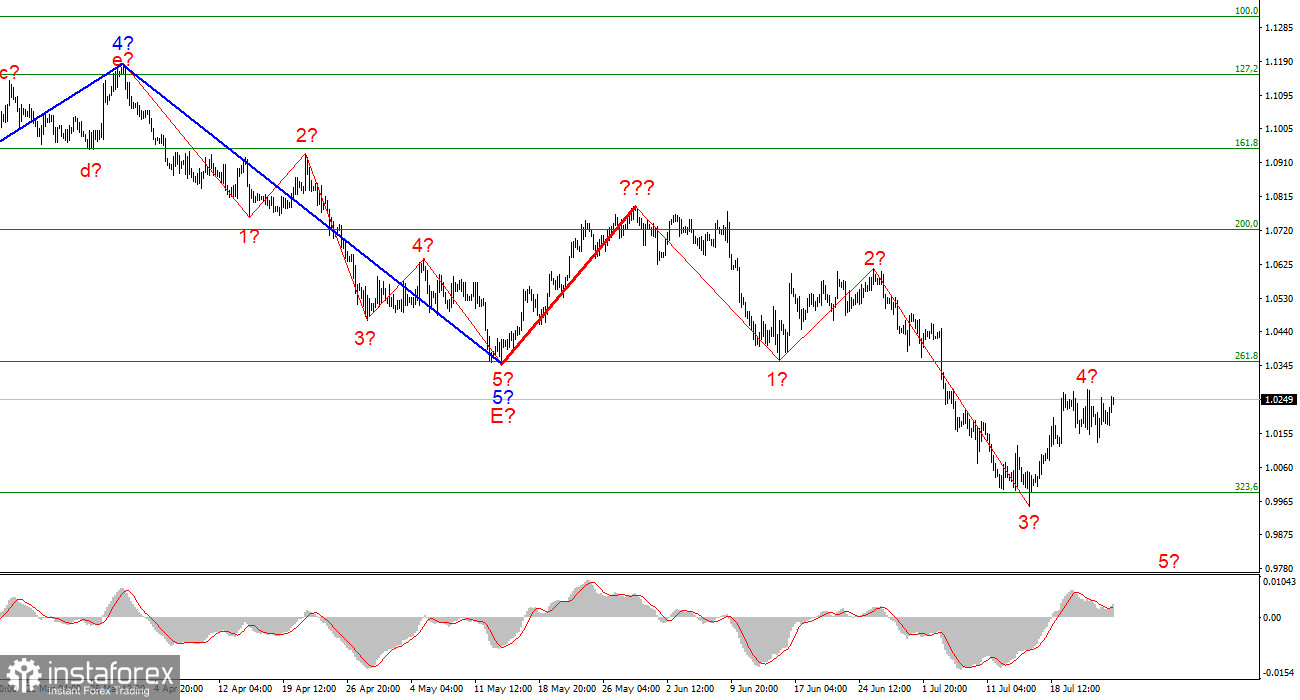
The wave marking of the 4-hour chart for the euro/dollar instrument became more complicated a few weeks ago and now does not have a completely holistic look. A successful attempt was made to break through the 261.8% Fibonacci level, which was also the low of the waves E and b, so these waves are hardly E and b anymore. I have built a new wave layout, which does not yet consider the rising wave marked with a bold red line. I have already said that the entire wave structure can be complicated an unlimited number of times. Wave analysis is a disadvantage since any structure can always take a more complex and extended form. Therefore, now I propose to work on simpler wave structures that contain waves of a lower scale.
As you can see, the construction of an upward wave is now continuing, which may be wave 4 of a new downward trend section. If this assumption is correct, the instrument may rise another 100-150 basis points upwards, after which the instrument will decline within wave 5 with targets below 1.0000. The construction of wave 5 could have already begun. So far, I don't see any reason to expect any other instrument movements.
The euro risks breaking the wave marking.
The euro/dollar instrument rose by 30 basis points on Monday. It is a small distance to conclude changes in the current wave markup. Wave 4 looks complete and, most importantly, commensurate with the other waves in the current structure. And this is very important. At the current levels, I am waiting for a new decrease in the instrument, which requires an increase in demand for the US currency. The next event this week that could trigger this demand is the FOMC meeting, which will be announced on Wednesday. From my point of view, this is a very good moment, as the market is waiting for a new, strong increase in the interest rate. And any rate increase is a reason for growth for the currency. Thus, I expect that wave 5 will begin its construction this week.
If my calculations are incorrect and the market does not react with purchases of the US dollar to an increase in the FOMC rate, then wave 4 can continue its construction. It will lead to an even greater increase in the instrument, and then the 261.8% Fibonacci mark will be of great importance, which is also the low of wave 1. A successful attempt to break through it will mean that the peak of wave 4 will go beyond the low of wave 1, and the entire descending wave structure will no longer be considered impulsive. Let me remind you that, according to the British, the descending set of waves can no longer be considered impulsive. Thus, even in the case of the complication of wave 4, the descending structure of the waves will remain, and we will still have reason to wait for a new fall of the instrument. However, in this case, the decline may not be as strong as in the variant with the impulse section of the trend. In any case, I am waiting for at least one more decline to the 1.0000 mark.
General conclusions.
Based on the analysis, I conclude that the construction of the downward trend section continues. If so, it is now possible to sell the instrument with targets located near the estimated 0.9397 mark, which is equal to 423.6% Fibonacci, for each MACD signal "down" in the calculation of the construction of wave 5. Wave 4 can already be completed.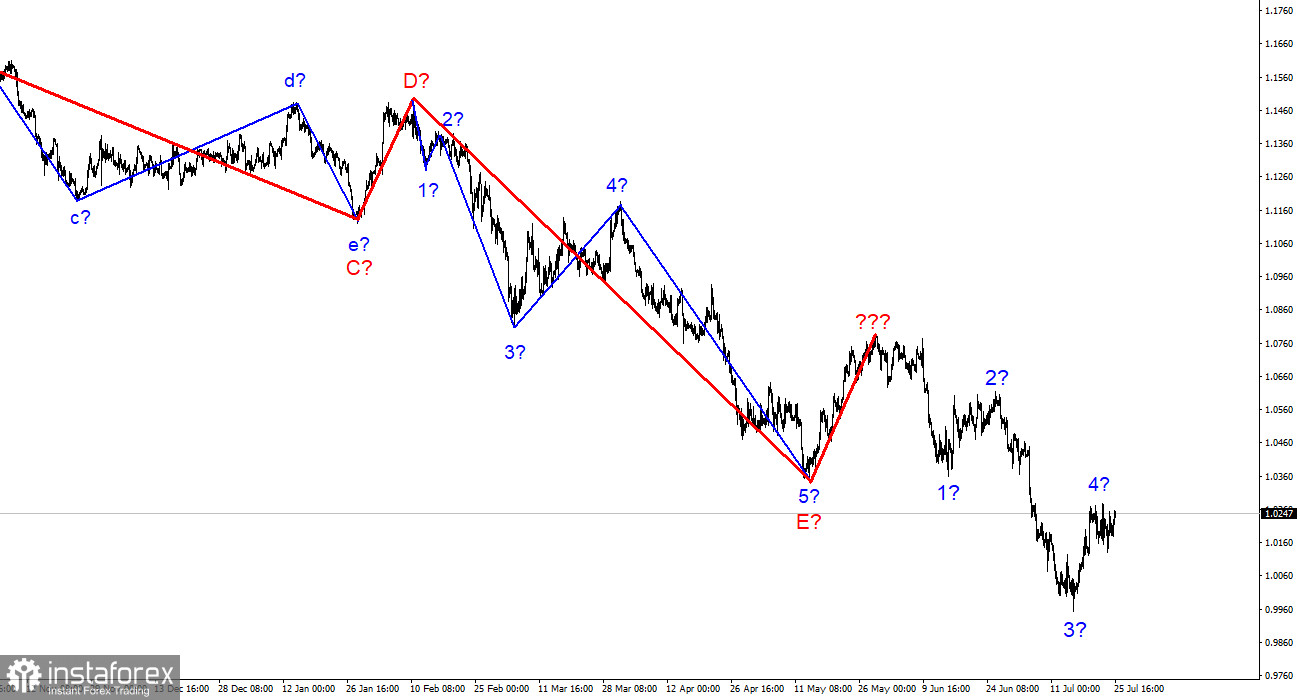
At the higher wave scale, the wave marking of the descending trend segment becomes noticeably more complicated and lengthens. It can take on almost any length, so I think it's best to isolate three and five-wave standard wave structures and work on them.


