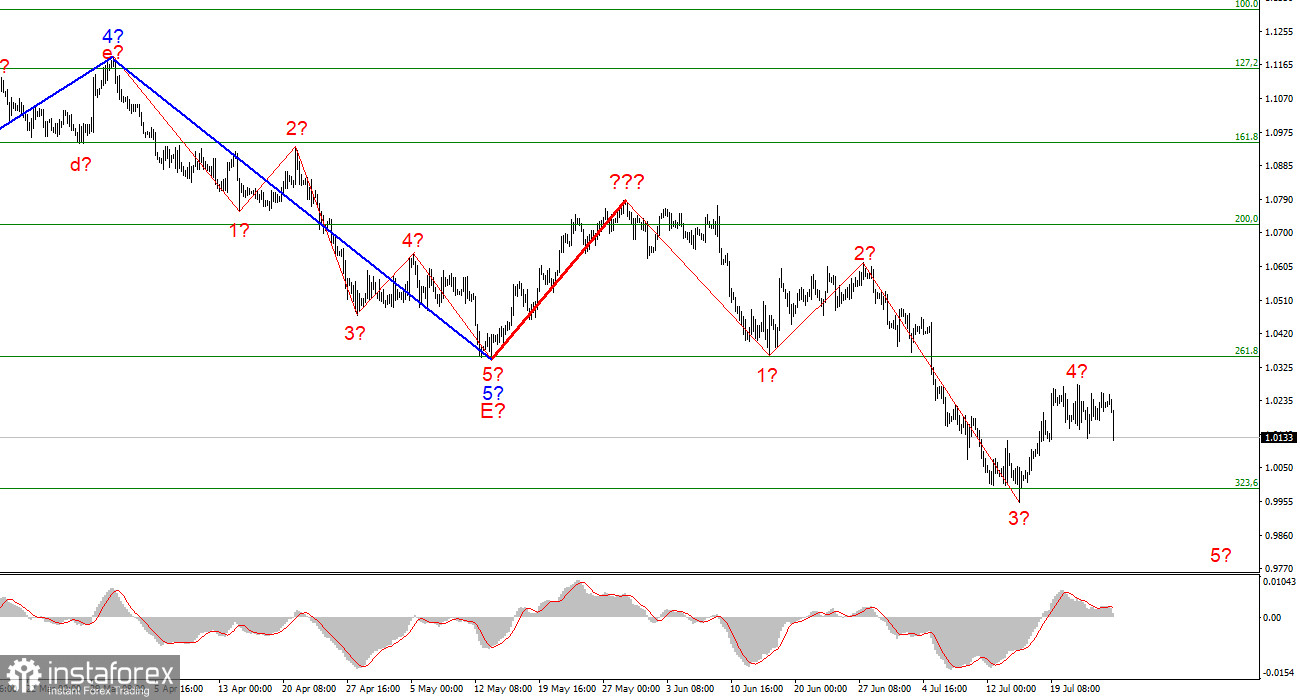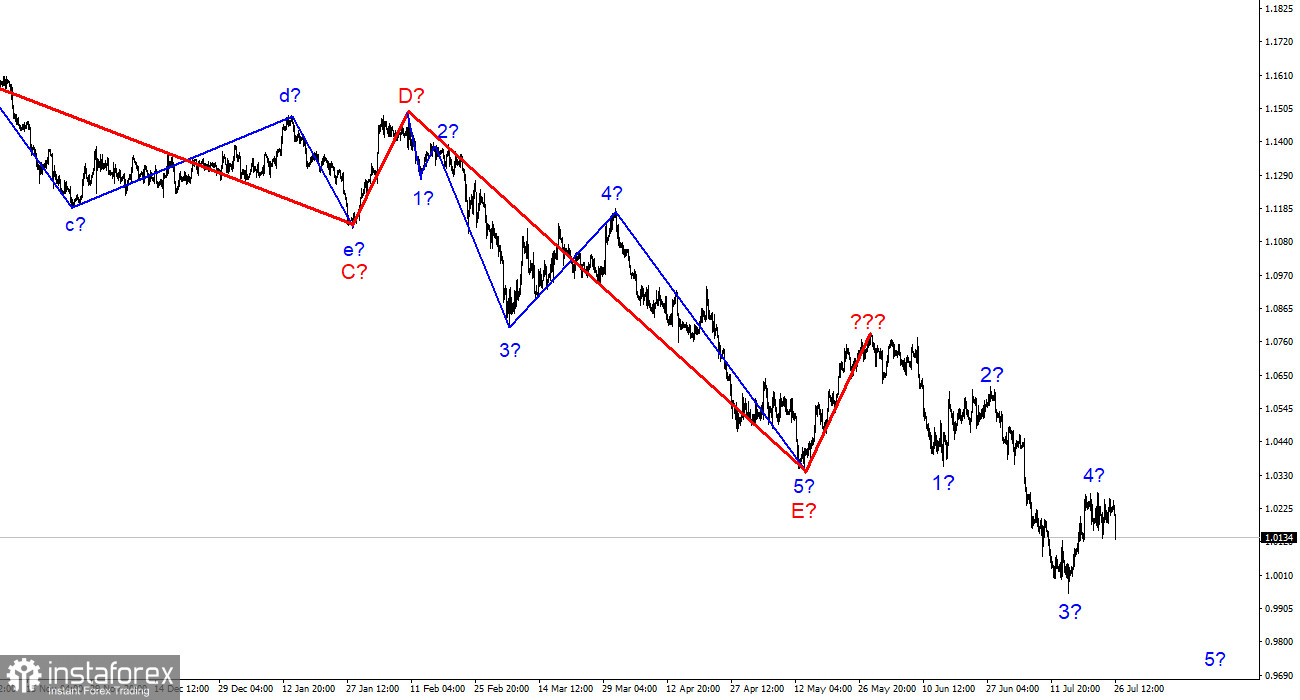
A few weeks ago, the wave marking on the 4-hour chart for the euro/dollar instrument grew more sophisticated, but no alterations are necessary now. There was a successful attempt to break through the Fibonacci level of 261.8%, which was also the low of the waves E and b; hence, these waves are no longer E and b. I have constructed a new wave pattern that does not yet account for the rising wave denoted by a bold red line. I've already stated that the entire wave structure can be complicated indefinitely. It is the drawback of wave analysis, as any structure is always capable of assuming a more complicated and extensive shape.
Consequently, I propose to now focus on simpler wave structures, including waves of a smaller scale. As shown, the development of a descending wave, which may be wave 5 of a new downward trend section, has likely commenced. If this assumption is accurate, the instrument has begun its decline with goals below 1.0000. So far, I see no reason to anticipate additional instrument moves.
On Tuesday, the euro/dollar pair declined by 100 basis points. The instrument has been in a restricted range for over a week, and I am unsure whether wave 4 has concluded. With today's downturn, I can state with a great degree of certainty that it has ended. Let me remind you that the FOMC will summarize the conclusions of its two-day meeting tomorrow, and there is little doubt that a decision will be taken in support of a further 75 basis point increase in the interest rate. As inflation in the United States continues to grow, some analysts are considering a one-time hike of 100 basis points. However, high-interest rates in the United States are not the only factor dragging the euro down. The situation within the European Union is extremely convoluted and fragile, despite the absence of a full-blown economic or political catastrophe. However, it is not yet evening.
Remember that the energy market is the primary "field" of conflict between the EU and Russia. It is advantageous for the European Union to import gas and oil from Russia because pipelines have been constructed and long-term contracts have been made, but with the beginning of a special operation in Ukraine, the European Union has begun to dread Moscow. Therefore, he initiated the introduction of comprehensive sanctions for aggression in Ukraine. Sanctions against banks and oligarchs, the freezing of assets of the Russian Federation – all of this, of course, affects the Kremlin, but oil and gas are the principal sources of revenue for the Russian budget. And Europe has a harder time giving up oil and gas. We are speaking of amazing numbers that are difficult to replace with energy carriers from other nations, which will be more expensive and more complicated to transport to the EU (there are no pipelines). If the issue were to be settled with oil (while we are not proposing a complete rejection of oil from Russia), the gas would be far more challenging. Ursula von der Leyen appears to have agreed with Azerbaijan to enhance gas supplies to the EU, but this winter could be extremely harsh and frigid for the entire European Union. Many analysts are currently discussing a "gas crisis" that could be detrimental to the sector.
General observations.
I infer based on my findings that construction of the downward trend segment continues. If this is the case, it is now viable to sell the instrument with goals at the estimated 0.9397 level, which corresponds to 423.6% Fibonacci, for each "down" MACD signal generated during the development of wave 5. Wave 4 is currently completeable.

At the larger wave size, the wave marking of the descending trend segment becomes considerably more complex and extends in length. It can assume virtually any length, so I believe it is best to focus on three and five-wave conventional wave shapes for the time being.


