


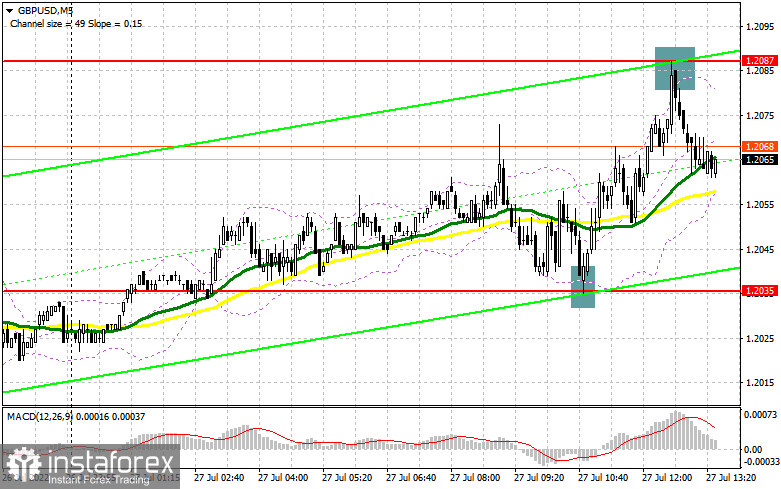
In my morning review, I mentioned the level of 1.2035 and recommended entering the market from it. Let's have a look at the 5-minute chart and see what happened there. A decline in the price and a false breakout of this level created a good entry point for going long. As a result, the pound rose by more than 50 pips to the area of 1.2087. At this point, bears stepped in probably because this level was a weekly high. After a false breakout and a sell signal, the pair dropped by 27 pips. At the moment of writing, the pressure on the pair has increased ahead of the Fed meeting. From the technical viewpoint, nothing has really changed which means our strategy remains the same.
For long positions on GBP/USD:
Today, bulls will get a chance to assert their strength if the macroeconomic data from the US comes in worse than expected. The durable goods orders and goods trade balance reports are due to be published today. The downbeat data will most probably push the price to test the level of 1.2087 for the fourth time. However, for a fully-fledged bullish trend, the price needs to break out of this range. If the pound weakens in the second half of the day, it will be better to buy the pair after a false breakout at 1.2035, just like I described in my morning review. The moving averages supporting the bullish trend are also found here. In this case, the price may return to the weekly high of 1.2087but may struggle to overcome it. A break of this level will open the way towards the high of 1.2119. Its breakout and a downward retest will create stronger upside momentum and a buy signal with the target at 1.2160. Then the price may hit the next level of 1.2207 where I recommend profit taking. If GBP/USD depreciates and buyers are idle near 1.2035 in the afternoon, the pound will come under more pressure. Yet, its trajectory will be mainly determined by the outcome of the Fed meeting. If this is the case, I recommend buying the pair only after it reaches 1.2001. Long positions can be opened on a false breakout or on a rebound from 1.1964, or even lower from 1.1929, considering a correction of 30-35 pips within the day.
For short positions on GBP/USD:
Today, bears will fully rely on the decision of the US Federal Reserve after a 2-day meeting of the FOMC. If the US regulator maintains its hawkish stance, we can bet on another downward wave in GBP/USD and on new yearly lows. However, if there are no drastic changes, the pound may soon enter the bullish market again. In the afternoon, bears may need to do their best to stop the price from moving above the 1.2087 level as this is what happened in the morning session. It would be reasonable to open short positions on a false breakout if the US data turns out to be strong. This will push the pound lower to the interim support of 1.2035 that was formed yesterday. Its breakout and a downward retest will create a good entry point to sell the pair with the target located at 1.2001. This is where I recommend profit taking. The level of 1.1694 will serve as a more distant target. But it will be relevant only in the worst-case scenario and if the Fed tightens its monetary policy. If GBP/USD rises and bears are idle at 1.2087 in the course of the New York session, bulls will regain control over the market. In this case, I wouldn't recommend selling the pair. A breakout of the new high of 1.2119 will create an entry point for opening short positions, considering a downside pullback of the price. If nothing happens there as well, the pair may rush to the upside. If so, it is better to wait until the pair reaches the levels of 1.2160 and 1.2207. At this point, you can sell GBP/USD right after a rebound, keeping in mind a possible downward correction of 30-35 pips within the day.
COT report:
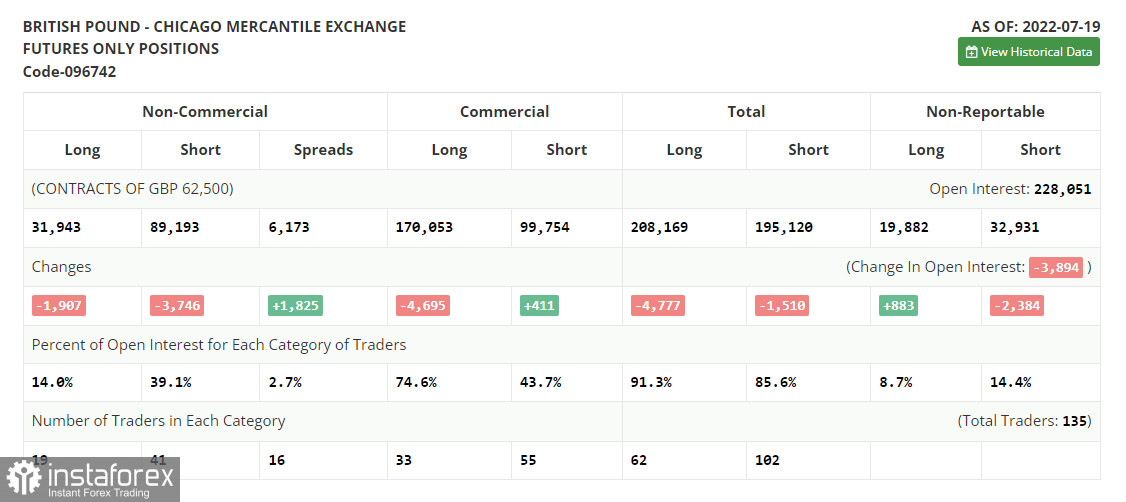
The Commitment of Traders (COT) report for July 19 showed that both short and long positions decreased. Yet, the decline in short positions was bigger which resulted in a slight decrease in the negative value of the delta. Apparently, bulls are buying the pound at yearly lows and downplaying the economic state of the UK. Probably, the measures taken by the BoE and its policy of raising rates have the desired effect. The further trajectory of the pound will depend on the announcement by the US Federal Reserve. The regulator is expected to raise the rate by 0.75% which may support the US dollar. However, the greenback will remain strong as long as the Fed sticks to its policy. Otherwise, the pound will get the chance to strengthen ahead of the BoE's meeting in August. The UK central bank may also increase the rate at this meeting. Yet, the bullish market is unlikely to last long, especially given the cost of living crisis and a looming recession in the UK. According to the COT report, long positions of the non-commercial group of traders dropped by 1,907 to 31,943, while short ones declined by 3,746 to 89,193. As a result, the negative non-commercial net position decreased to -57 250 from -59 089. The weekly closing price went up to 1.2013 from 1.1915
Indicator signals:
Moving Averages
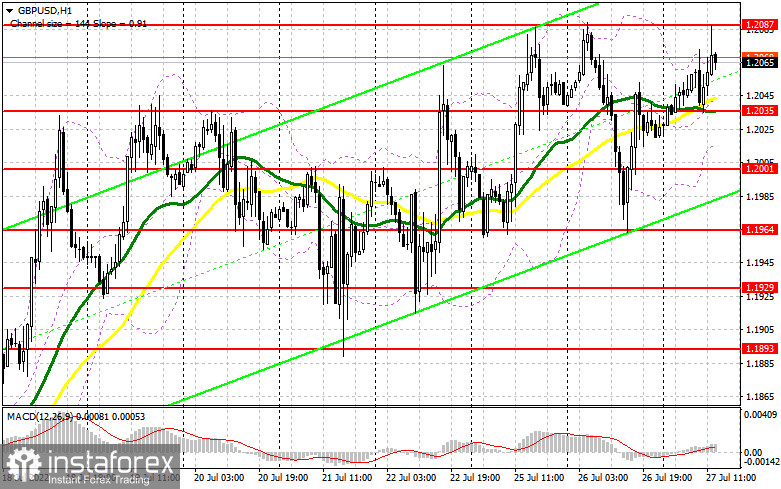
Trading above the 30 and 50-day moving averages indicates that bills are trying to regain control over the market.Please note that the time period and levels of the moving averages are analyzed only for the H1 chart, which differs from the general definition of the classic daily moving averages on the D1 chart.
Bollinger Bands
In case of a decline, the lower band of the indicator at 1.2010 will serve as support.
Description of indicators:
• A moving average of a 50-day period determines the current trend by smoothing volatility and noise; marked in yellow on the chart;
• A moving average of a 30-day period determines the current trend by smoothing volatility and noise; marked in green on the chart;
• MACD Indicator (Moving Average Convergence/Divergence) Fast EMA with a 12-day period; Slow EMA with a 26-day period. SMA with a 9-day period;
• Bollinger Bands: 20-day period;
• Non-commercial traders are speculators such as individual traders, hedge funds, and large institutions who use the futures market for speculative purposes and meet certain requirements;
• Long non-commercial positions represent the total number of long positions opened by non-commercial traders;
• Short non-commercial positions represent the total number of short positions opened by non-commercial traders;
• The total non-commercial net position is the difference between short and long positions of non-commercial traders.


