


Analysis of Wednesdays deals:
30M chart of the GBP/USD pair
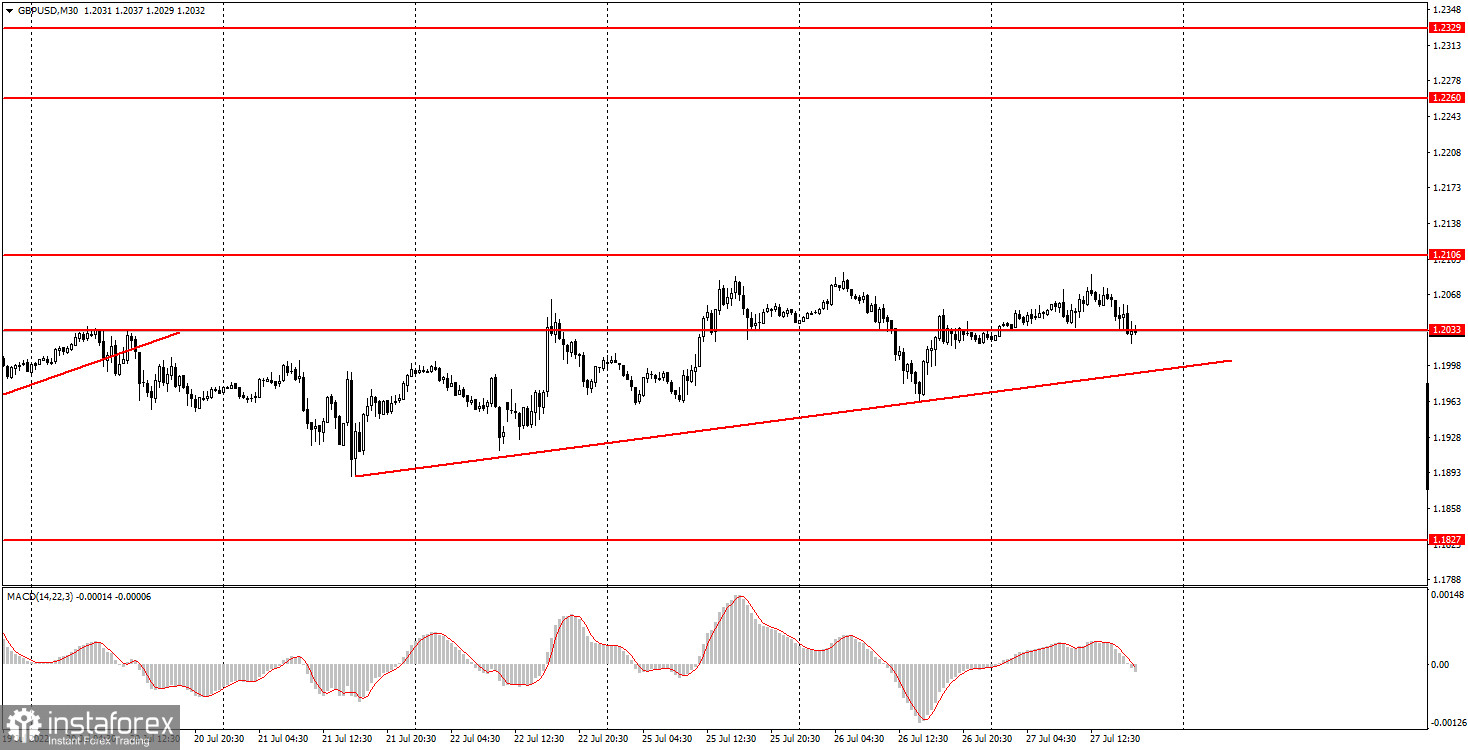
The GBP/USD pair also showed very sluggish movements with no clear direction on Wednesday. However, we even formed an upward trend line to show novice traders that there is still a slight upward trend. This trend line is practically meaningless, since in a few hours the pound can easily and simply overcome it. And then go back above it. The pair's movements in the next few hours after the announcement of the results of the Federal Reserve meeting are always roulette. The pair can go up 100 points, then down 100 points, and then the same amount up. Movements can be absolutely unpredictable, even if (as it is now) the results of the meeting are already 80% known. Thus, we advise novice players to look at the overall technical picture and draw conclusions tomorrow, when the market fully wins back the rate hike, Fed Chairman Jerome Powell's comments will calm down. We also do not undertake to predict where the pound will be tomorrow, since it can be at a distance of 150-200 points from the current value, and in any direction. Of course, the pound's growth will be an illogical market reaction to a Fed rate hike, but illogical reactions happen from time to time. If it were possible to predict the reaction of the market to some event with a 100% probability, then all currency traders would be millionaires, and there would simply be no losers, which is a priori impossible.
5M chart of the GBP/USD pair
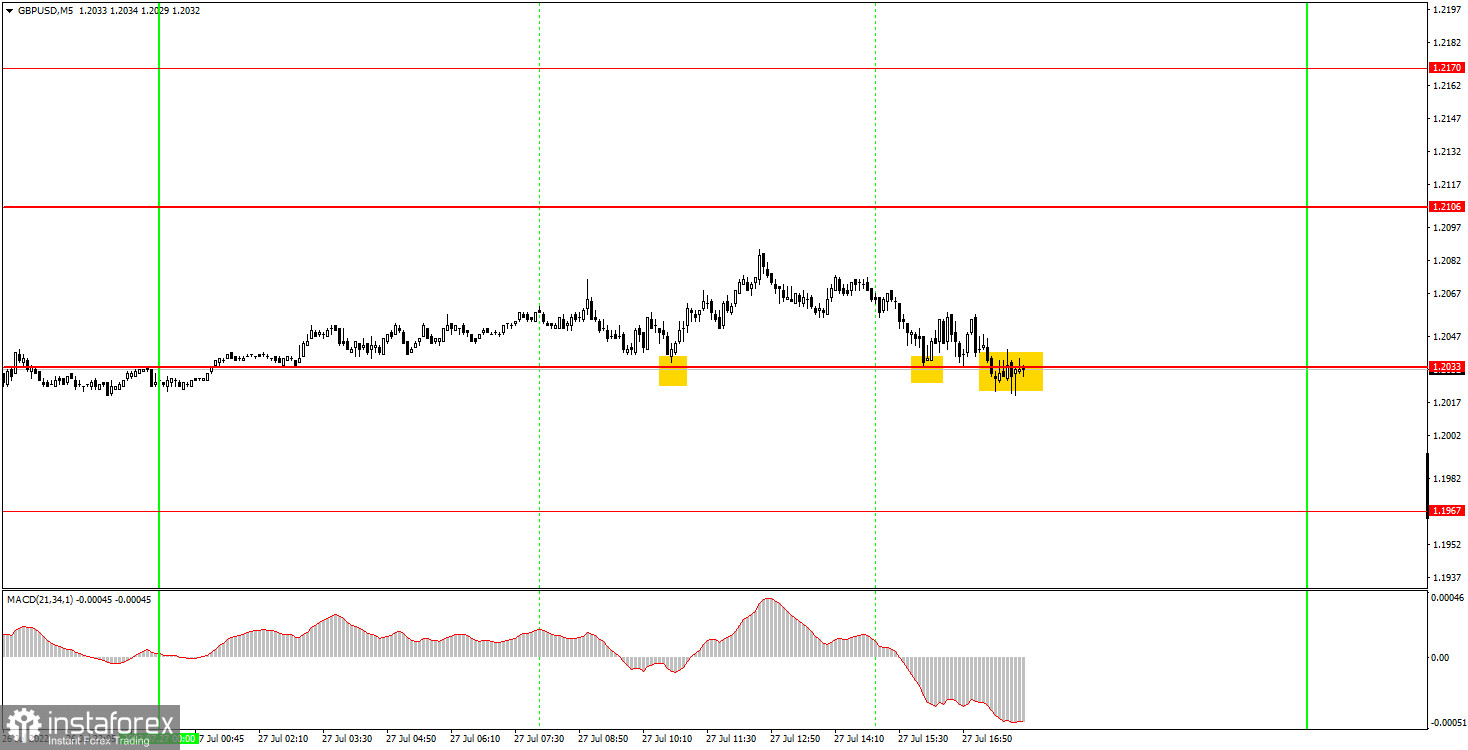
It is clearly seen on the 5-minute timeframe that the movement on Wednesday was almost sideways. The price bounced from the level of 1.2033 three times and never managed to reach the nearest target level. In our case, 1.2106. Although going 70 points in one direction has never been a problem for the pound. But the market simply didn't want to trade and take unnecessary risks until there was a clear understanding of how much the Fed would raise the rate and what would happen next. Thus, all three signals can be considered false. During the formation of the first of them, the price went in the right direction for 43 points, in the second - 12, and in any case, the third signal should not have been worked out, since it was formed too late. Therefore, the first deal could be closed by Stop Loss at breakeven, the second – just at breakeven, manually, since the price failed to consolidate below the level of 1.2033.
How to trade on Thursday:
The pound/dollar pair continues to try to maintain a new upward trend on the 30-minute TF. However, the movement is now incomprehensible, unstable and looks more like a flat than a trend. Thus, just in case, we recommend sticking to a cautious trading style. Moreover, in a few hours the Fed will raise its key rate, which means that the market may react very violently. On the 5-minute TF on Thursday it is recommended to trade at the levels 1.1807-1.1827, 1.1898, 1.1967, 1.2033, 1.2106, 1.2170. When the price passes after opening a deal in the right direction for 20 points, Stop Loss should be set to breakeven. Again, no major events or reports are scheduled for Thursday in the UK. Thus, traders can only pay attention to the report on GDP in the second quarter of the US, which can also be ignored. However, if the actual value is very different from the forecast, the reaction may still follow.
Basic rules of the trading system:
1) The signal strength is calculated by the time it took to form the signal (bounce or overcome the level). The less time it took, the stronger the signal.
2) If two or more deals were opened near a certain level based on false signals (which did not trigger Take Profit or the nearest target level), then all subsequent signals from this level should be ignored.
3) In a flat, any pair can form a lot of false signals or not form them at all. But in any case, at the first signs of a flat, it is better to stop trading.
4) Trade deals are opened in the time period between the beginning of the European session and until the middle of the US one, when all deals must be closed manually.
5) On the 30-minute TF, using signals from the MACD indicator, you can trade only if there is good volatility and a trend, which is confirmed by a trend line or a trend channel.
6) If two levels are located too close to each other (from 5 to 15 points), then they should be considered as an area of support or resistance.
On the chart:
Support and Resistance Levels are the Levels that serve as targets when buying or selling the pair. You can place Take Profit near these levels.
Red lines are the channels or trend lines that display the current trend and show in which direction it is better to trade now.
The MACD indicator (14,22,3) consists of a histogram and a signal line. When they cross, this is a signal to enter the market. It is recommended to use this indicator in combination with trend lines (channels and trend lines).
Important speeches and reports (always contained in the news calendar) can greatly influence the movement of a currency pair. Therefore, during their exit, it is recommended to trade as carefully as possible or exit the market in order to avoid a sharp price reversal against the previous movement.
Beginners on Forex should remember that not every single trade has to be profitable. The development of a clear strategy and money management are the key to success in trading over a long period of time.


