


Trend analysis (Fig. 1)
GBP/USD will continue increasing on Thursday, from 1.2152 (closing of yesterday's daily candle) to 1.2213, which is the historical resistance level (blue dotted line). Then, it will decline to the 14.6% retracement level at 1.2122 (blue dotted line), before bouncing up.
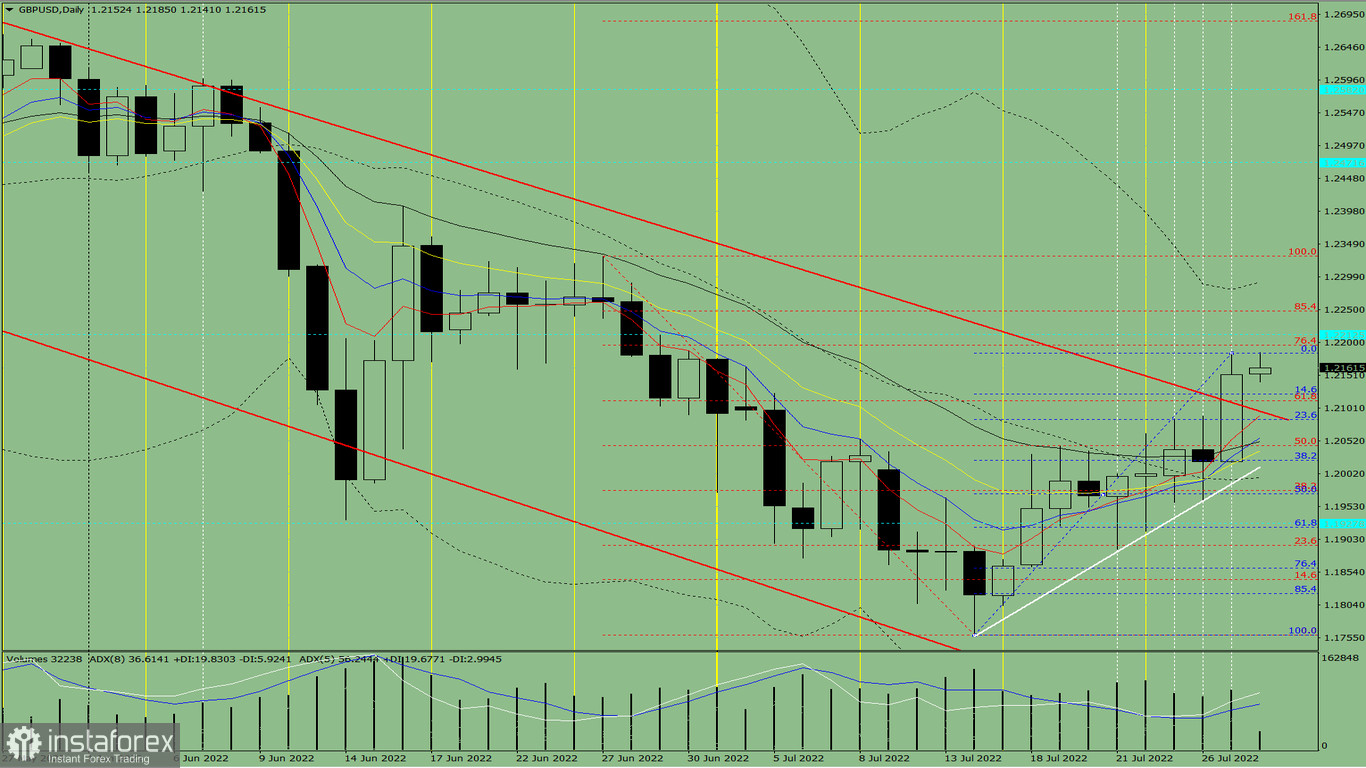
Fig. 1 (daily chart)
Comprehensive analysis:
Indicator analysis - downtrend
Fibonacci levels - downtrend
Volumes - downtrend
Candlestick analysis - uptrend
Trend analysis - uptrend
Bollinger bands - uptrend
Weekly chart - uptrend
Conclusion: GBP/USD will rise from 1.2152 (closing of yesterday's daily candle) to the historical resistance level at 1.2213 (blue dotted line), then decrease to the 14.6% retracement level at 1.2122 (blue dotted line). The quote will rebound after that.
Alternatively, the pair could climb from 1.2152 (closing of yesterday's daily candle) to the 76.4% retracement level at 1.2196 (red dotted line), then go to the 23.6% retracement level at 1.2084 (dashed blue line). Following this will be a continued price increase.


