


Analysis of Thursday's deals:
30M chart of the EUR/USD pair
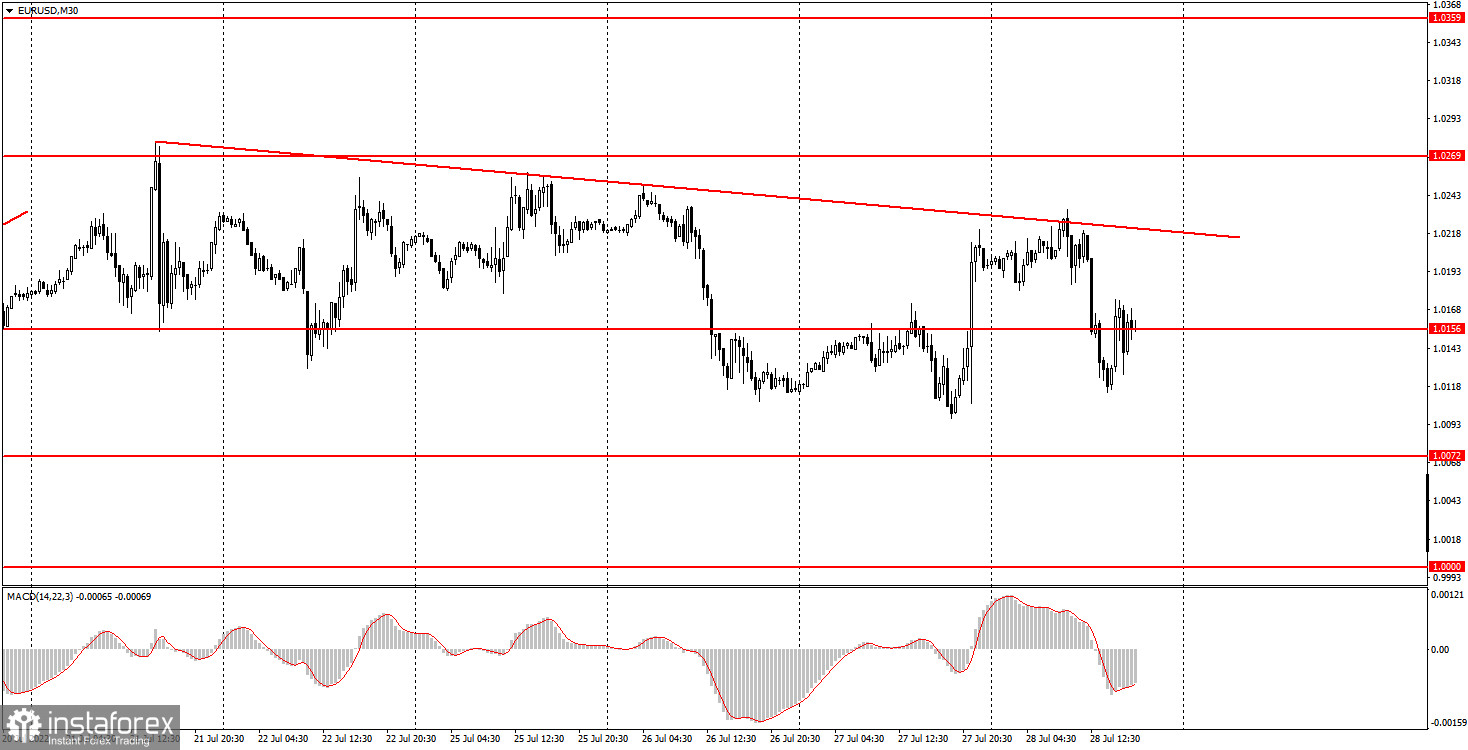
The EUR/USD currency pair on Thursday showed what we talked about last night before the announcement of the results of the Federal Reserve meeting. Recall that the reaction after such an important event can last a day or even more, so conclusions should be drawn after this period. What did we see on Wednesday evening? The Fed raised the key rate by 0.75%, which is a very hawkish decision, but the US currency did not rise, but rather fell. Unfortunately, this is the case when the nature of the fundamental event absolutely does not coincide with the nature of the market reaction. Simply put, the market reacted illogically. However, we recall that such situations arise from time to time, and the Fed meeting is generally such an important event that it makes no sense to predict movements after it. On Thursday, the pair rushed down from local highs and by the end of the day dropped to the levels at which it was located yesterday, before the Fed meeting. This suggests that the market recognizes the illogicality of the reaction on Wednesday evening. By and large, the pair is now continuing to trade sideways, not trending. However, we managed to form a downtrend line that highlights the minimal downward slope of the movement. In general, we believe that the euro will resume to fall.
5M chart of the EUR/USD pair
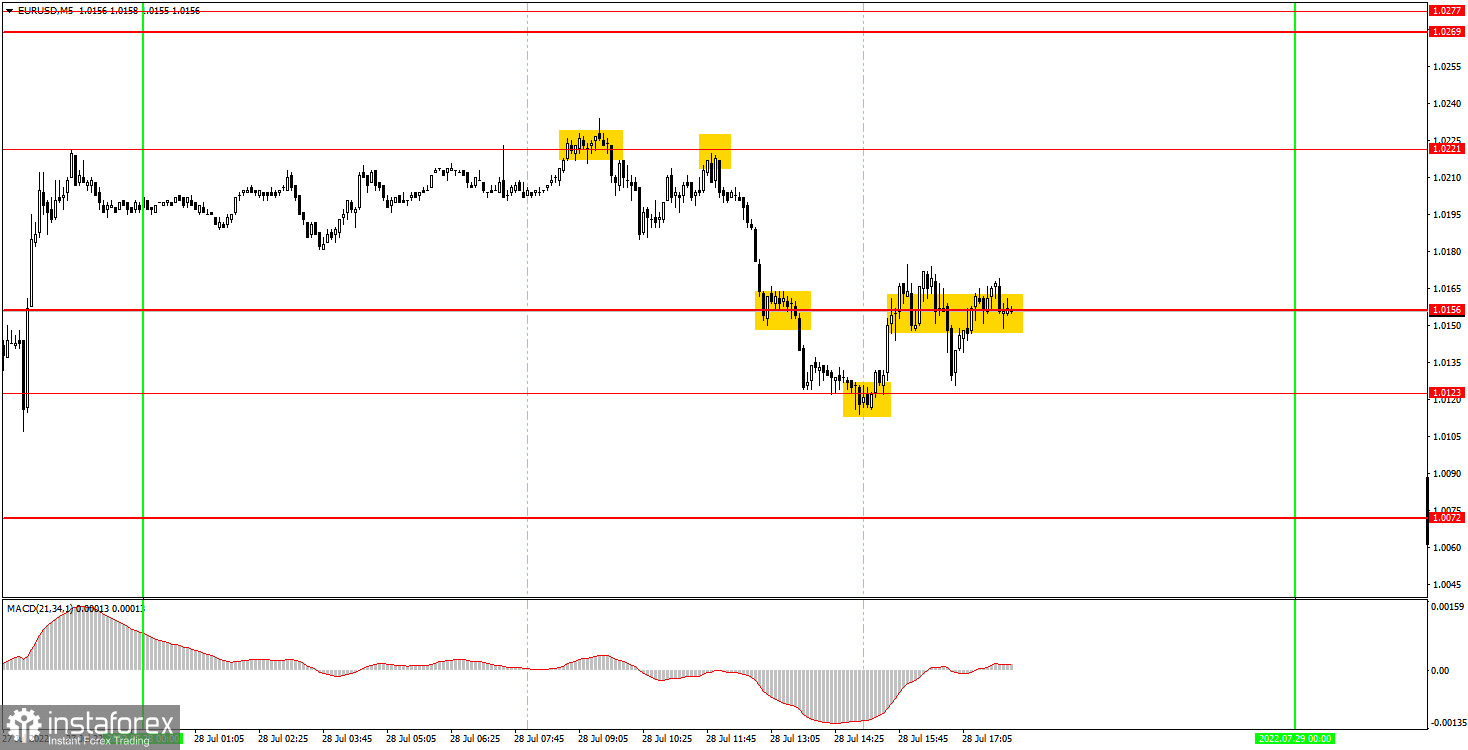
Thursday's movement on the 5-minute timeframe was not bad, but it should immediately be indicated that we have added a new level of 1.0221, which is the previous day's high. The two strongest signals were formed around this level, which brought good profits to novice traders. The price rebounded from this level both times, but the first time it managed to go down only 25 points, so the deal was closed at breakeven by Stop Loss. The second short position was more successful, because this time the price dropped to the level of 1.0156, overcame it and reached the level of 1.0123. A rebound from this level should be considered as a buy signal and shorts should be closed. Longs should have been opened immediately, which also brought a small profit, since the price worked out and even overcame the nearest target of 1.0156. This was followed by a signal to sell (consolidating below 1.0156), but this deal was closed at breakeven by Stop Loss, and this time the pair did not reach the target level. As a result, beginners could earn about 85 points of profit on Thursday.
How to trade on Friday:
The upward trend has been reversed on the 30-minute timeframe, but the new downtrend line is weak and the move looks more like a flat than a trend. By and large, the pair continues to move sideways with minor flaws. Until the price settles above the trend line, one can count on the euro's further fall, especially after the results of the Fed meeting. On the 5-minute TF on Friday, it is recommended to trade at the levels of 1.0000, 1.0072, 1.0123, 1.0156, 1.0221, 1.0269-1.0277, 1.0354. When passing 15 points in the right direction, you should set Stop Loss to breakeven. The EU will release the first important report this week. GDP for the second quarter will be published in the first estimate. And at the same time inflation for July, which is likely to show new growth. We only have secondary reports in America, which are unlikely to be of interest to the market.
Basic rules of the trading system:
1) The signal strength is calculated by the time it took to form the signal (bounce or overcome the level). The less time it took, the stronger the signal.
2) If two or more deals were opened near a certain level based on false signals (which did not trigger Take Profit or the nearest target level), then all subsequent signals from this level should be ignored.
3) In a flat, any pair can form a lot of false signals or not form them at all. But in any case, at the first signs of a flat, it is better to stop trading.
4) Trade deals are opened in the time period between the beginning of the European session and until the middle of the US one, when all deals must be closed manually.
5) On the 30-minute TF, using signals from the MACD indicator, you can trade only if there is good volatility and a trend, which is confirmed by a trend line or a trend channel.
6) If two levels are located too close to each other (from 5 to 15 points), then they should be considered as an area of support or resistance.
On the chart:
Support and Resistance Levels are the Levels that serve as targets when buying or selling the pair. You can place Take Profit near these levels.
Red lines are the channels or trend lines that display the current trend and show in which direction it is better to trade now.
The MACD indicator (14,22,3) consists of a histogram and a signal line. When they cross, this is a signal to enter the market. It is recommended to use this indicator in combination with trend lines (channels and trend lines).
Important speeches and reports (always contained in the news calendar) can greatly influence the movement of a currency pair. Therefore, during their exit, it is recommended to trade as carefully as possible or exit the market in order to avoid a sharp price reversal against the previous movement.
Beginners on Forex should remember that not every single trade has to be profitable. The development of a clear strategy and money management are the key to success in trading over a long period of time.


