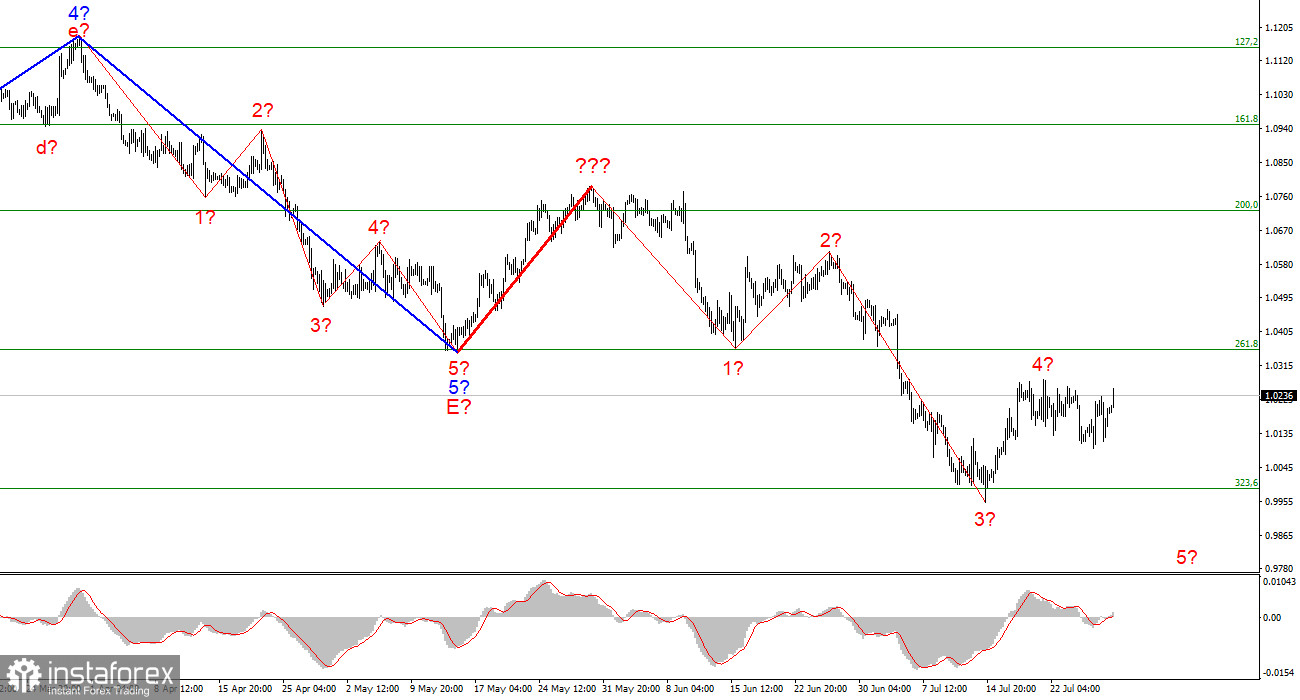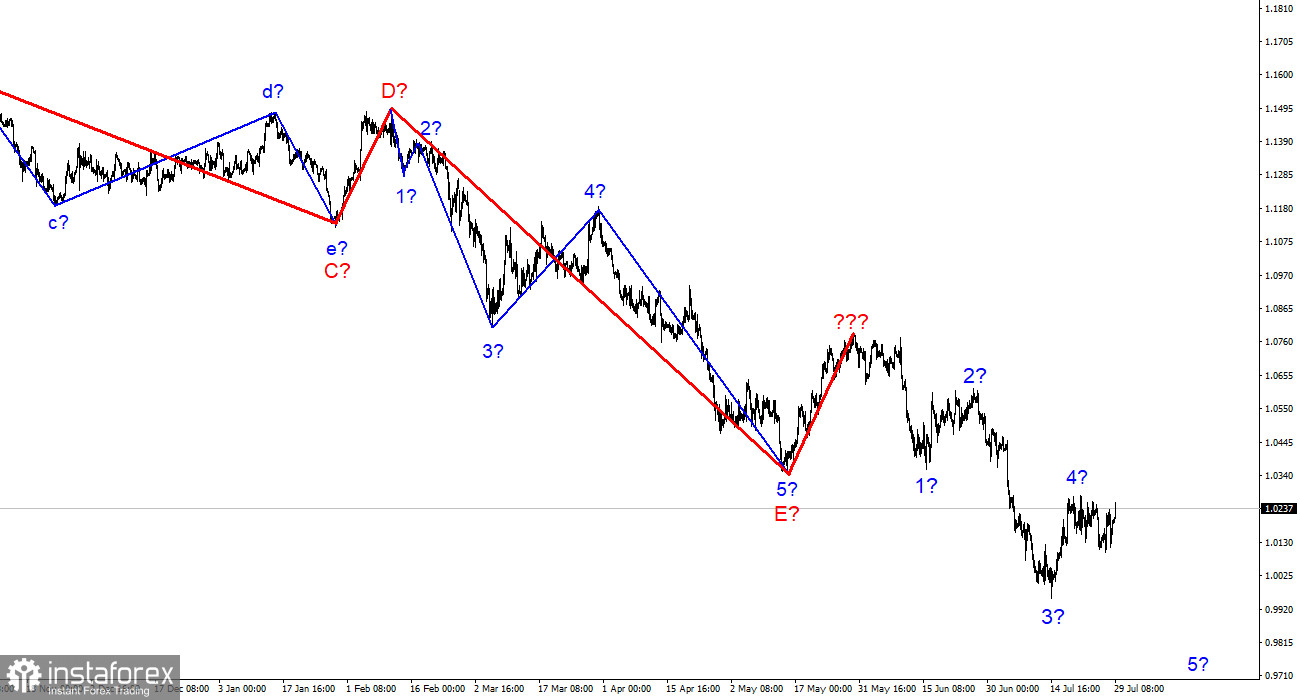
The wave marking of the 4-hour chart for the euro/dollar instrument became more complicated a few weeks ago but, at the moment, does not require new adjustments. A successful attempt was made to break through the 261.8% Fibonacci level, which was also the low of the waves E and b, so these waves are hardly E and b anymore. I have built a new wave layout, which does not yet consider the rising wave marked with a bold red line. I have already said that the entire wave structure can be complicated an unlimited number of times. Wave analysis is a disadvantage since any structure can always take a more complex and extended form. Therefore, now I propose to work on simpler wave structures that contain waves of a lower scale.As you can see, the construction of a descending wave has presumably begun, which may be wave 5 of a new downward trend section. If this assumption is correct, the instrument has resumed its decline with targets below 1.0000. However, the lack of decline in recent weeks within this wave suggests to me that wave 4 may take a more complex form. Now I would like to avoid this since, in this case, the whole wave pattern may take a more complex form.
The Fed raised the interest rate, but US GDP fell for the second quarter in a row
The euro/dollar instrument first declined on Thursday and then grew. On Friday – at first, it grew, and then it decreased. The European currency has grown by 20 basis points compared to Wednesday's close. Thus, I cannot conclude that the increase of the instrument will be prolonged, and wave 4 will take a more serious form. I want to note that important data on inflation and GDP will be released in the European Union in an hour, which can determine the market mood for today and the following week. The market will have to combine all the data received over the past few days, and there is a lot of such data, which may be contradictory. For example, the Fed raised the rate by 75 basis points, but the next day it became known that there was a strong drop in US GDP in the second quarter. The ECB also raised the rate by 50 points, but today it may become known about a new increase in inflation and, possibly, a drop in GDP. Thus, data on tightening monetary policy may support currencies, but data on the economy's decline – on the contrary. And how all this will be taken into account by the markets and how they will react, the question remains open.
From my point of view, in such a frankly incomprehensible situation, one should still rely on wave analysis. The euro currency has not received unconditional support from the news background, and the US dollar can still be in high demand. And the wave pattern assumes the construction of a new descending wave. Therefore, I consider it necessary to wait for statistics from the European Union and, if they turn out to be weak, prepare for a new decrease in the instrument. I believe that the euro currency still retains a high potential for decline.
General conclusions
Based on the analysis, I conclude that the construction of the downward trend section continues. If so, it is now possible to sell the instrument with targets located near the estimated 0.9397 mark, which is equal to 423.6% Fibonacci, for each MACD signal "down" in the calculation of the construction of wave 5. Wave 4 can already be completed.

At the higher wave scale, the wave marking of the descending trend segment becomes noticeably more complicated and lengthens. It can take on almost any length, so I think it's best to isolate three and five-wave standard wave structures and work on them.


