


Long-term perspective.
This week, the EUR/USD currency pair did not increase by a single point. Considering the 4-hour time frame, it appears that despite the flat, the pair is moving rather vigorously. However, when switching to a 24-hour TF, it is evident that there are virtually no market fluctuations, and the pattern is much less apparent. Specifically, the same long-term downward trend that has persisted for the past year and a half persists, and the euro currency is still unable to react normally to this trend. Let us examine it. Since the downturn began three weeks ago, the euro has gained almost 300 points. Currently, the pair cannot even surpass the critical line, let alone do anything else. The underlying backdrop remained favorable for the US dollar, as the Fed hiked rates by 0.75 percent once again and Jerome Powell vowed another "aggressive tightening" if inflation does not respond to another rate hike. And although the dollar did not appreciate this week when it should have, the euro was unable to reap any rewards. At the same time, it should be highlighted that the United States GDP was again negative in the second quarter, while the European Union continued to rise. This aspect appears to be supportive of the euro, but the divergent monetary policies of the Federal Reserve and the European Central Bank discourage traders from purchasing the euro. One may even argue that the market is currently in disarray. On the one hand, the dollar should be purchased given that the Fed rate is significantly higher than the ECB rate, but on the other hand, the US economy has contracted for two consecutive quarters while the EU economy is expanding. In general, the situation remains uncertain, and it is possible to navigate along the Kijun-sen line with a 24-hour TF. If the pair can get a footing above it, many hundred points of increase can be anticipated.
COT evaluation.
In the previous six months, COT's reports on the euro currency have aroused a vast number of issues. During the majority of 2022, professional players displayed an openly "bullish" attitude, although the European currency was declining at the same time, as depicted in the diagram above. Currently, circumstances have changed, but not in favor of the euro currency. If the sentiment was previously "bullish" but the euro was falling, it is now "bearish" and the euro is also falling. Therefore, we currently see no reason for the euro to grow, given the vast majority of variables continue to work against it. During the reporting week, the number of buy contracts grew by 2,100, while the number of shorts in the "Non-commercial" group grew by 1,000. Consequently, the net position has increased by only 1,000 contracts. In recent weeks, the "bearish" sentiment of the key players has grown steadily stronger. From our perspective, this demonstrates very vividly that even expert traders do not now believe in the euro currency. The quantity of buy contracts for non-commercial traders is 41 thousand fewer than the number of sell contracts. Consequently, we can state that not only is the demand for the US dollar still fairly high but so is the desire for the euro. It may result in a new, even larger decline in the euro's value. In theory, the euro currency has not been able to demonstrate even a tangible correction during the past six months, let alone anything more. The greatest upward rise was almost 400 points.
Evaluation of fundamental occurrences.
The Fed meeting was the most notable event of the week. However, so much has already been said about it that it is unnecessary to rehash it. The dollar was expected to strengthen significantly after the 0.75 percentage point rate hike, but this did not occur. Since there is now no indication of the conclusion of the long-term slump, we anticipate that the dollar's upward trend will begin a little later. In the European Union, a report on GDP for the second quarter (+0.7 percent versus a prediction of 0-0.2 percent) and an inflation report were released (8.9 percent in July with a forecast of 8.6-9.0 percent ). As can be seen, inflation in the European Union continues to rise, but this is not surprising given that the ECB has raised rates for the first time this month. Therefore, economic expansion is explicable and rising inflation is warranted. The United States GDP declined by 0.9%, which is understandable considering the significant increase in the Fed's main interest rate. The American economy has already entered the "recession" swamp with one foot, but traders are not yet concerned.
Trading strategy for the week of August 1-5:
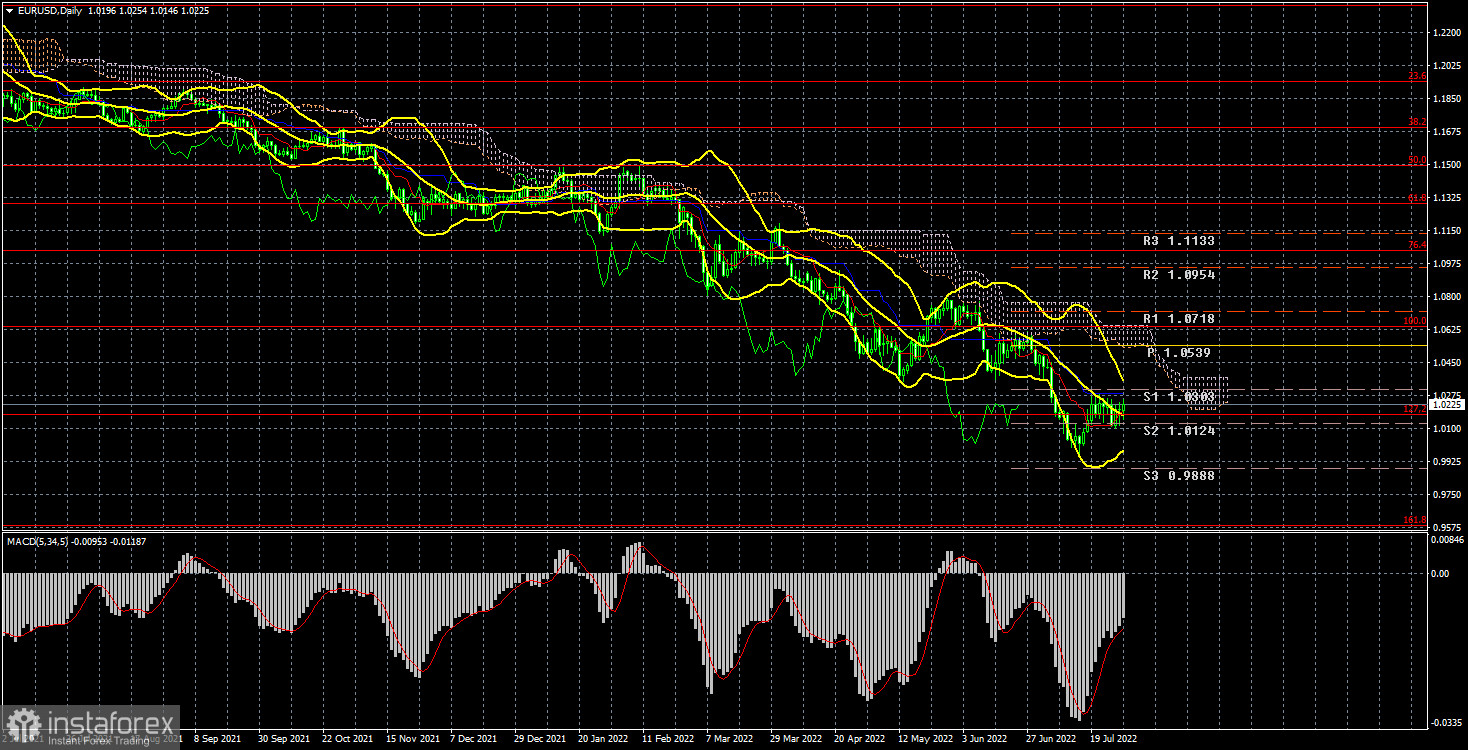
1) The pair continues to trade near its 20-year lows on the 24-hour chart. Nearly all elements continue to support the dollar's long-term growth. Traders were unable to overcome the Ichimoku cloud, thus the euro's upward momentum and purchases remained irrelevant. It is crucial to at least wait for consolidation above the Senkou Span B line before considering long bets.
2) Sales of the euro/dollar pair remain more relevant at this time. The price has adjusted to the key line, but until this level is overcome, the bearish trend remains unchanged, and the rebound from this line can be seen as a sell signal with a 0.9582 price target (161.8 percent Fibonacci).
Explanations of the figures:
Price levels of support and resistance (resistance /support), Fibonacci levels – levels used as entry points for buying and sales. Take Profit levels may be positioned nearby.
Ichimoku indicators (standard settings), Bollinger Bands (standard settings), MACD (5, 34, 5).
The first indicator on the COT charts is the net position size of each trading category.
On the COT charts, indicator 2 represents the net position size for the "Non-commercial" group.


