


Trend analysis
EUR/USD quotes will increase this week, from 1.0222 (closing of the last weekly candle) to 1.0367, which is the 50.0% retracement level (yellow dotted line). Then, it will continue moving up to the 61.8% retracement level at 1.0464 (yellow dotted line), before returning to 1.0338, which is the support level (thick blue line).
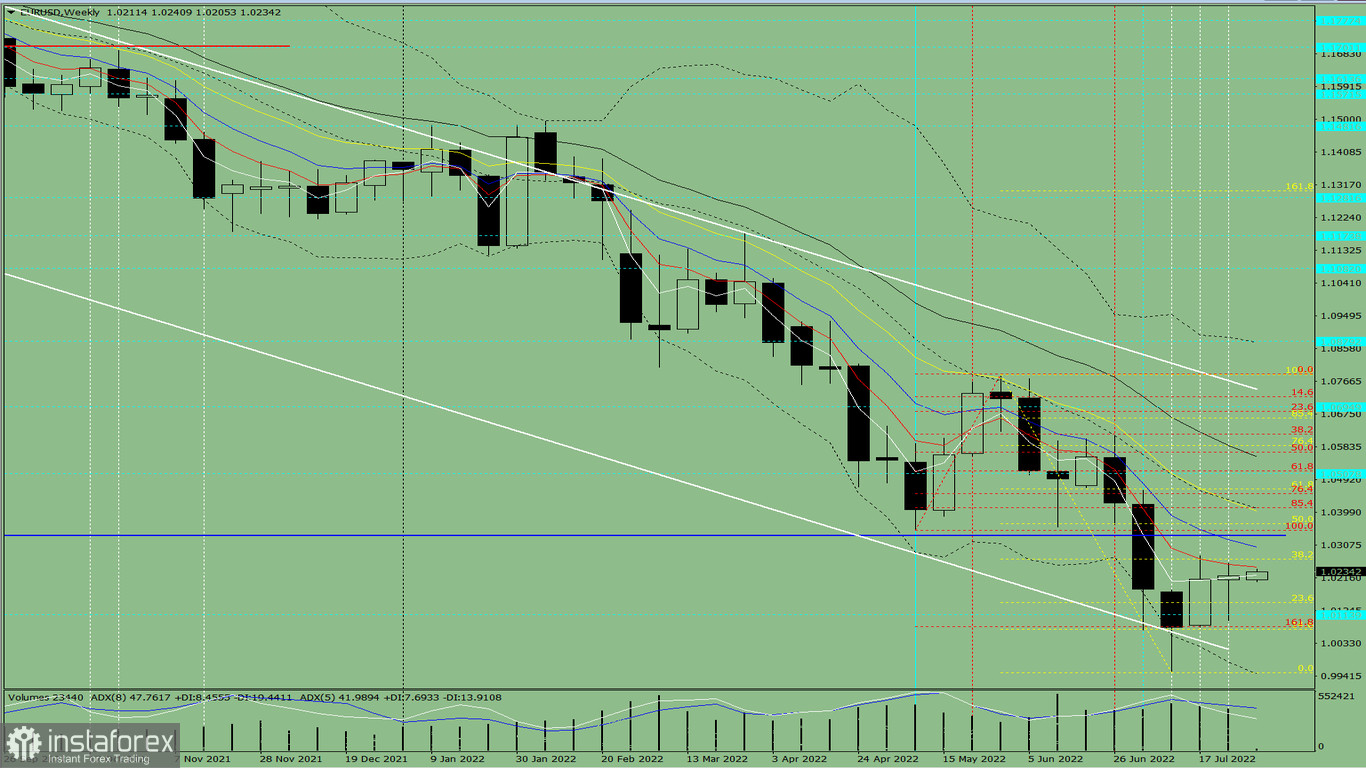
Fig. 1 (weekly chart)
Comprehensive analysis:
Indicator analysis - uptrend
Fibonacci levels - uptrend
Volumes - uptrend
Candlestick analysis - uptrend
Trend analysis - uptrend
Bollinger bands - uptrend
Monthly chart - uptrend
All this points to an upward movement in EUR/USD.
Conclusion: The pair will have an upward trend, with no first lower shadow on the weekly white candle (Monday - up) and no second upper shadow (Friday - up).
During the week, euro will climb from 1.0222 (closing of the last weekly candle) to the 50.0% retracement level at 1.0367 (yellow dotted line), go to the 61.8% retracement level at 1.0464 (yellow dotted line), and bounce back to the support level at 1.0338 (thick blue line).
Alternatively, the pair could rise from 1.0222 (closing of the last weekly candle) to the resistance level of 1.0335 (thick blue line), then fall to the 161.8% retracement level at 1.0079 (red dotted line). Following this will be another increase to the 38.2% retracement level at 1.0267 (yellow dotted line).


