


Trend analysis
GBP/USD will move up in August, starting from the closing of the July monthly candle at 1.2173 to the 23.6% retracement level at 1.2340 (red dotted line). Upon reaching it, the quote will continue rising to the 38.2% retracement level at 1.2701 (red dotted line), then roll back downwards.
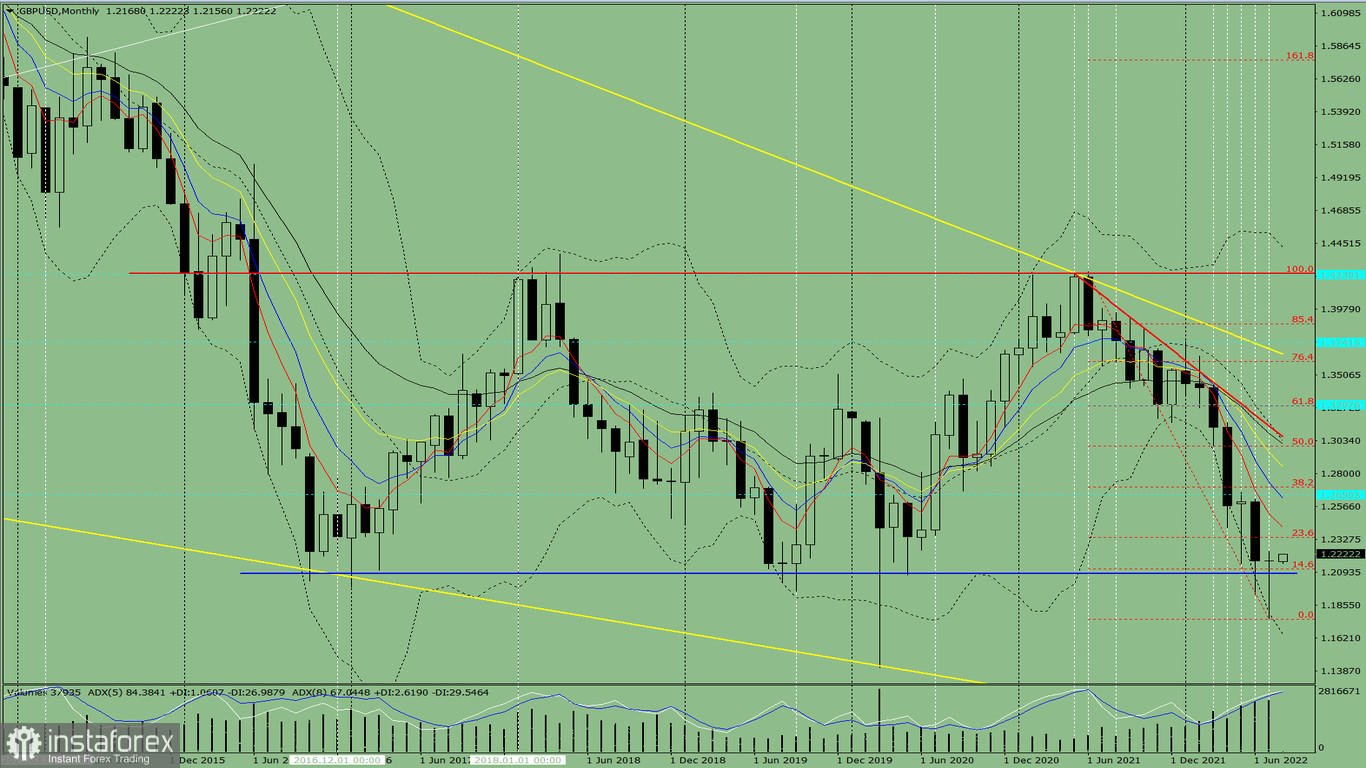
Fig. 1 (monthly chart)
Comprehensive analysis:
Indicator analysis - uptrend
Fibonacci levels - uptrend
Volumes - uptrend
Candlestick analysis - uptrend
Trend analysis - uptrend
Bollinger bands - uptrend
All this points to an upward movement in GBP/USD.
Conclusion: The pair will have an upward trend with no first lower shadow on the monthly white candle (the first week of the month is white) and a second upper shadow (the last week is black).
Throughout the month, quotes will climb from 1.2173 (closing of the July monthly candle) to the 23.6% retracement level at 1.2340 (red dotted line), go further up to the 38.2% retracement level at 1.2701 (red dotted line), then turn downwards.
Alternatively, pound could decrease from 1.2173 (closing of the July monthly candle) to the lower fractal at 1.1759 (red dotted line), then bounce up to the 14.6% retracement level at 1.2117 (red dotted line).


