


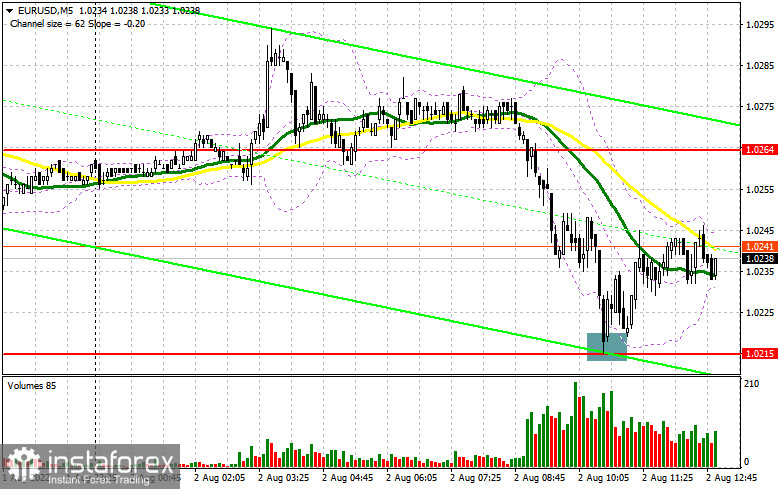
In the morning article, I highlighted the level of 1.0215 and recommended making decisions with this level in focus. Now let's look at the 5-minute chart and try to figure out what actually happened. The euro failed to consolidate at monthly highs. A breakout of the nearest support level of 1.0264 occurred without a downward test. So, there was no sell signal. After hitting the 1.0215 level, a false breakout took place. It gave a good entry point into long positions, which was in line with the morning scenario. At the time of writing the article, the pair had advanced by about 30 pips. After that, it halted its rise. In the afternoon, the technical outlook changed slightly.
What is needed to open long positions on EUR/USD
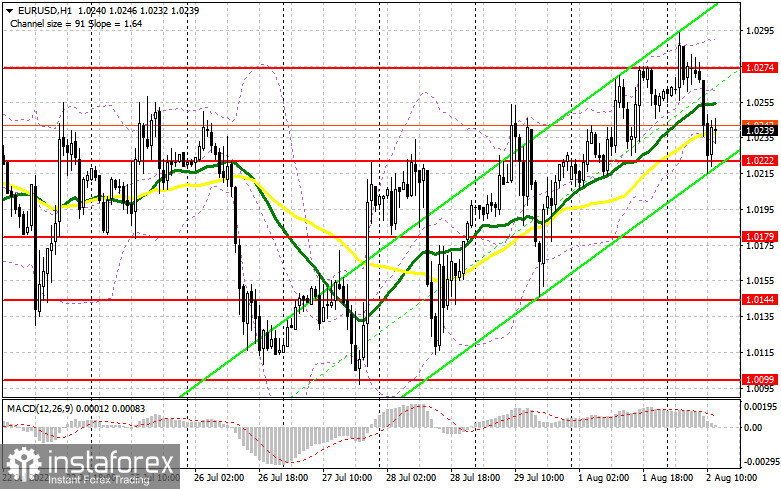
As long as trading is carried out above 1.0222, the euro will maintain its bull run. The bulls will be aiming at the resistance level of 1.0274. US economic reports, which are on tap in the US session, will hardly help the US dollar grow. Thus, demand for the euro may return in the afternoon. Job openings and labor turnover data from the US Bureau of Labor Statistics do not have an impact on Forex. This is why they will shift their attention to the speech of FOMC member - Charles Evans. He will certainly touch on the topic of inflation and monetary policy. If the euro declines, speculators need to monitor how the bulls will act when the price reaches the new support level of 1.0222 formed in the first half of the day. Only a false breakout of this level after the release of US data will give another buy signal, fueling the rally. If so, the pair may return to 1.0274. The moving averages are passing below this level, limiting the upward potential of the pair. Only a breakout and a downward test of 1.0274 will lead to a decline in the sellers' Stop-Loss orders, giving a new buy signal. The pair is likely to rise to the level of 1.0323. The distant target will be the 1.0374 level where I recommend locking in profits. However, such a strong upward movement is unlikely to occur today. If EUR/USD decreases and the bulls show no energy at 1.0222, which is also likely, the pressure on the pair will escalate. A short-term rally that has been unfolding since July 27 will end. In this case, it is better to cancel long positions until a false breakout of 1.0179. If the bulls fail to defend this level, the bears may take the upper hand. You can buy EUR/USD immediately at a bounce from the level of 1.0144 or even a low of 1.0099, keeping in mind an upward intraday correction of 30-35 pips.
What is needed to open short positions on EUR/USD
The further trajectory of the euro depends on whether retail traders are still willing to buy at 1.0222. Judging by the fact that demand for the euro remains subdued after a rebound from 1.0222, the bears may try to regain ground during the American session. Of course, the optimal scenario for the second half of the day will be short positions with an upward correction of the euro to a new resistance level of 1.0274, formed at the end of the first half of the day. The price may advance if the tone of Charles Evans' speech is dovish. A false breakout of 1.0274 will provide a sell signal with the prospect of a fall to the support level of 1.0222. A breakout and consolidation below this level, as well as an upward test, will generate an additional sell signal. It will lead to a decline in the buyers' Stop- Loss orders, pushing the price down to 1.0179. If this scenario comes true, such a drop will affect traders who are betting on the continuation of the bull market. A decrease below 1.0179 will put an end to an upward movement. It will open the way to 1.0144 where I recommend closing all short positions. A more distant target will be the 1.0099 level which is the lower border of the new sideways channel. If EUR/USD jumps during the American session and the bears show no energy at 1.0274, it is better to postpone short positions to a more attractive resistance level of 1.0323. Only a false breakout of this level it is advisable to open short positions. You can see the EUR/USD pair immediately at a bounce from 1.0374 or a high of 1.0437, keeping in mind an intraday downward correction of 30-35 pips.
COT report
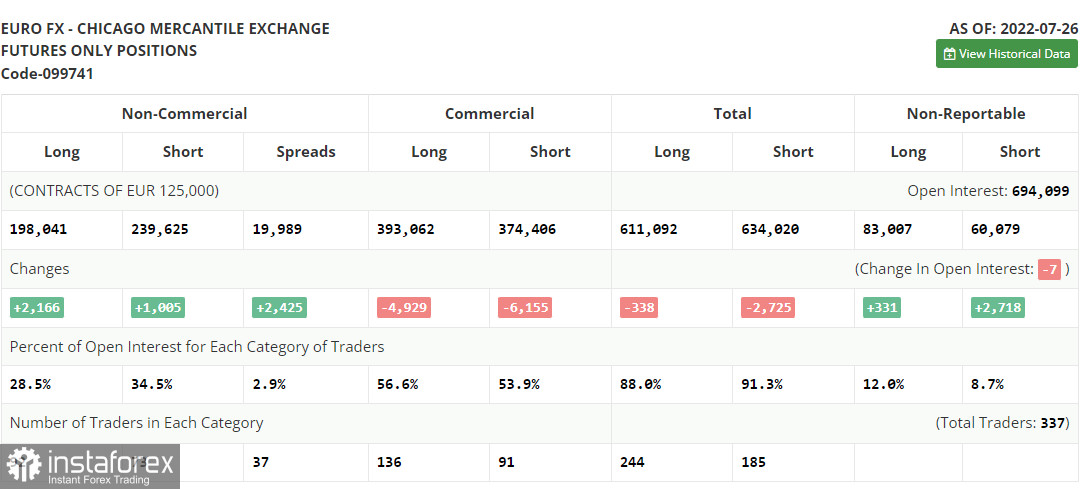
The COT report (Commitment of Traders) for July 26 logged an increase in both short and long positions. However, the number of long ones turned out to be bigger. It indicates the gradual end of the bear market and an attempt to find the bottom after reaching the parity level. The euro advanced amid economic reports for the EU released last week. A slight acceleration in inflation was eclipsed by a sharp growth of the European economy in the second quarter of this year. GDP rose by 4.0% in annual terms. This reading came as a pleasant surprise for economists. It also facilitated the bullish sentiment after the Fed hinted at a possible slowdown in monetary tightening. To this end, the EUR/USD pair is likely to approach new highs. The COT report revealed that the number of long non-commercial positions increased by 2,166, 198,041, while the number of short non-commercial positions jumped by 1,005 239,625. At the end of the week, the total non-commercial net position remained negative. Yet, it rose slightly to -41,584 from -42,745. The weekly closing price dropped to 1.0161 against 1.0278.
Signals of technical indicators
Moving averages
EUR/USD is trading below 30- and 50-period moving averages. It indicates the likelihood of a downward movement.
Remark. The author is analyzing the period and prices of moving averages on the 1-hour chart. So, it differs from the common definition of classic daily moving averages on the daily chart.
Bollinger Bands
In case of a rise, the upper border of 1.0280 will act as resistance. In case of a decline, the lower border of 1.0225 will act as support.
Definitions of technical indicators
- Moving average recognizes an ongoing trend through leveling out volatility and market noise. A 50-period moving average is plotted yellow on the chart.
- Moving average identifies an ongoing trend through leveling out volatility and market noise. A 30-period moving average is displayed as the green line.
- MACD indicator represents a relationship between two moving averages that is a ratio of Moving Average Convergence/Divergence. The MACD is calculated by subtracting the 26-period Exponential Moving Average (EMA) from the 12-period EMA. A 9-day EMA of the MACD called the "signal line".
- Bollinger Bands is a momentum indicator. The upper and lower bands are typically 2 standard deviations +/- from a 20-day simple moving average.
- Non-commercial traders - speculators such as retail traders, hedge funds, and large institutions who use the futures market for speculative purposes and meet certain requirements.
- Non-commercial long positions represent the total long open position of non-commercial traders.
- Non-commercial short positions represent the total short open position of non-commercial traders.
- The overall non-commercial net position balance is the difference between short and long positions of non-commercial traders.


