


Analysis of Tuesday's deals:
30M chart of the GBP/USD pair
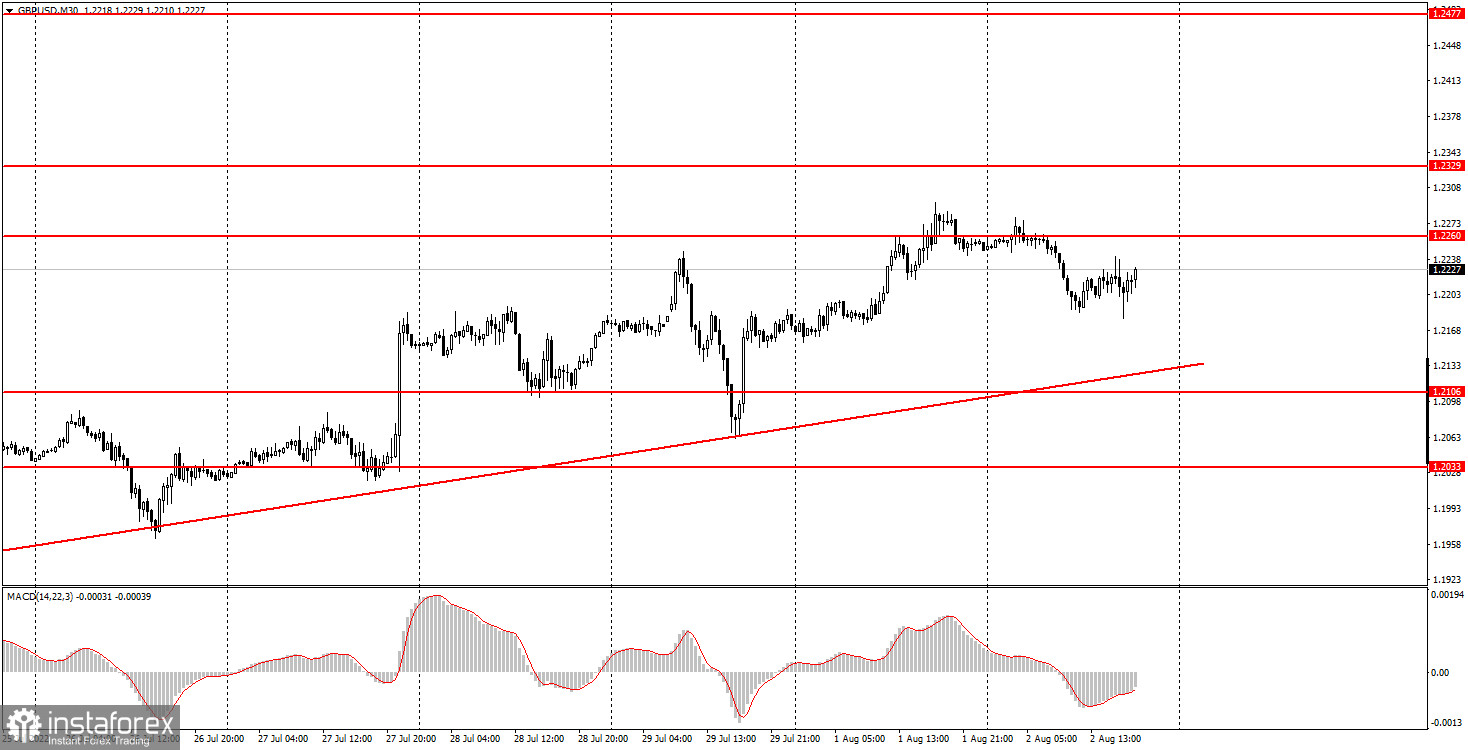
The GBP/USD pair showed good volatility on Tuesday, although the movement looks weak in the chart. However, the pair moved from the high to the low of the day of 100 points and maintained its upward trend as it is still above the trend line. It should be recognized that the upward trend is already quite long, so it will not be so easy to break it. However, we recall that this Thursday the Bank of England will announce the results of its meeting and, quite likely, will announce a rate hike of 0.5%. It is difficult for us to predict what the reaction to this event will be, but there will definitely be a reaction, and why not the fall of the British pound, which with a high degree of probability has already worked out the rate hike? However, as long as the price has not settled below the trend line, one should consider the option of the pound's further growth, and not vice versa. We also recall that the US NonFarm Payrolls report will be published on Friday, which has a degree of significance almost the same as the central bank meeting. Therefore, "crazy" Thursday and Friday may await us, after which the pound may be far from its current positions.
5M chart of the GBP/USD pair
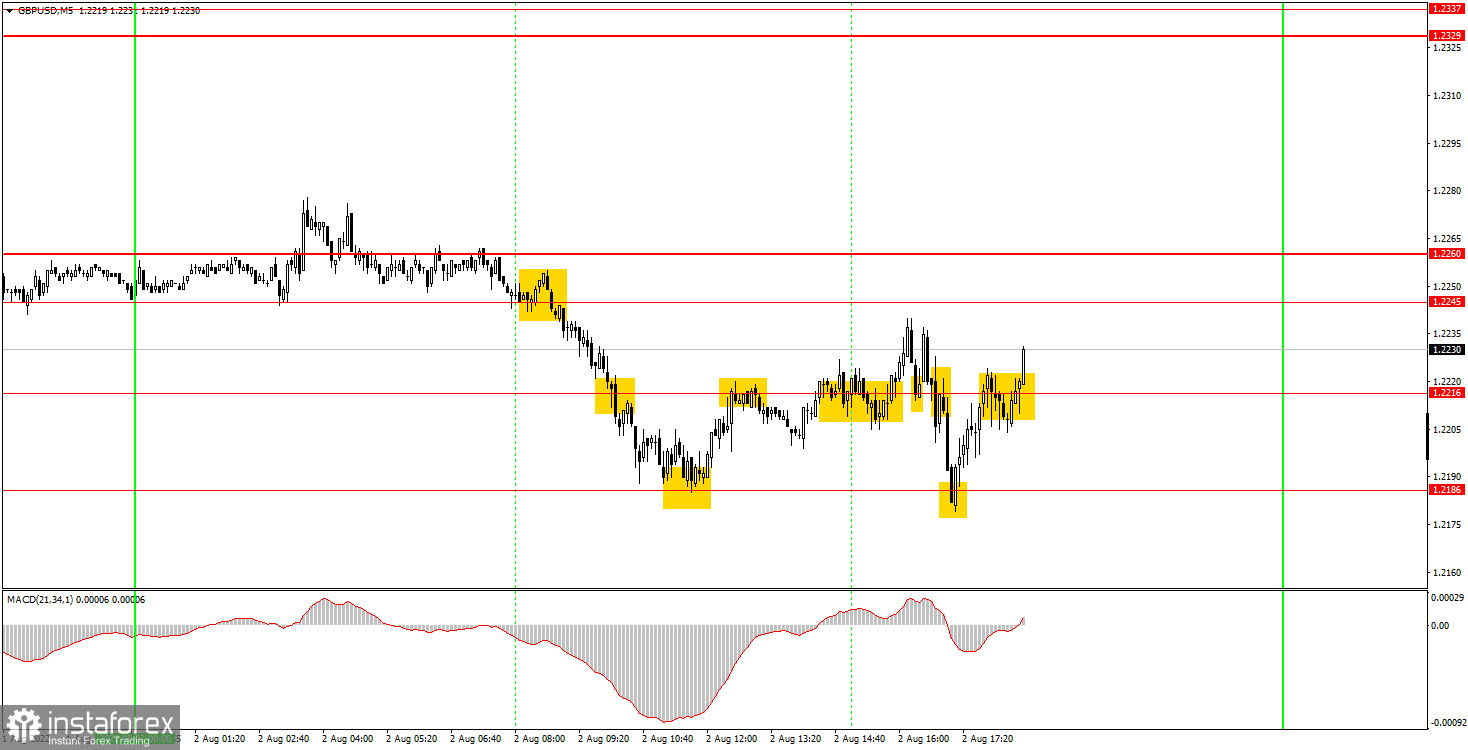
You can clearly see on the 5-minute timeframe that the pound/dollar pair changed direction too often, which is always bad for traders. There were a lot of levels, so there were enough signals. The first sell signal was formed when the price settled below the level of 1.2245, after which it managed to overcome 1.2216 and work out 1.2186. A rebound from the latter served as a buy signal, which should have been used to close short positions. Profit amounted to 40 points. Further, it was necessary to open long positions, which already brought less profit, since the price managed to grow only to the level of 1.2216 and rebounded from it. At this moment, it was necessary to get rid of longs and open shorts. However, neither this signal nor the next one allowed traders to earn. Neither in the first nor in the second case, the price could not work out either the nearest target level, or pass at least 20 points in the right direction. Therefore, both trades closed with a small loss and, probably, "ate" all the profit on the first two trades. All subsequent signals near the level of 1.2216 should not have been worked out, but the rebound from the level of 1.2186 could have been worked out with a long position, which made it possible to earn about 30 points. Thus, the day ended in profit after all.
How to trade on Wednesday:
The pound/dollar pair continues to maintain an upward trend on the 30-minute TF and may continue to grow until Thursday. The mood of traders may sharply change to bearish after the BoE meeting, and the NonFarm Payrolls report on Friday will also "add" to it. Consolidating below the trend line will signal a change in trend. On the 5-minute TF on Wednesday, it is recommended to trade at the levels 1.2106, 1.2186, 1.2216, 1.2245-1.2260, 1.2329-1.2337, 1.2371. When the price passes after opening a deal in the right direction for 20 points, Stop Loss should be set to breakeven. The UK and the US are scheduled to publish indexes of business activity in the services sector, the reaction to which may follow, but it is unlikely to be strong. However, even without statistics, the pound passes at least 100 points every day and keeps the trend.
Basic rules of the trading system:
1) The signal strength is calculated by the time it took to form the signal (bounce or overcome the level). The less time it took, the stronger the signal.
2) If two or more deals were opened near a certain level based on false signals (which did not trigger Take Profit or the nearest target level), then all subsequent signals from this level should be ignored.
3) In a flat, any pair can form a lot of false signals or not form them at all. But in any case, at the first signs of a flat, it is better to stop trading.
4) Trade deals are opened in the time period between the beginning of the European session and until the middle of the US one, when all deals must be closed manually.
5) On the 30-minute TF, using signals from the MACD indicator, you can trade only if there is good volatility and a trend, which is confirmed by a trend line or a trend channel.
6) If two levels are located too close to each other (from 5 to 15 points), then they should be considered as an area of support or resistance.
On the chart:
Support and Resistance Levels are the Levels that serve as targets when buying or selling the pair. You can place Take Profit near these levels.
Red lines are the channels or trend lines that display the current trend and show in which direction it is better to trade now.
The MACD indicator (14,22,3) consists of a histogram and a signal line. When they cross, this is a signal to enter the market. It is recommended to use this indicator in combination with trend lines (channels and trend lines).
Important speeches and reports (always contained in the news calendar) can greatly influence the movement of a currency pair. Therefore, during their exit, it is recommended to trade as carefully as possible or exit the market in order to avoid a sharp price reversal against the previous movement.
Beginners on Forex should remember that not every single trade has to be profitable. The development of a clear strategy and money management are the key to success in trading over a long period of time.


