


Trend analysis (Fig. 1).
On Thursday, the price may go up from 1.2144 (closing of yesterday's daily candlestick) to the 76.4% retracement level of 1.2196 (red dotted line). Should the quote test this mark, it may then rise to the 85.4% retracement level of 1.2247 (red dotted line) and extend the uptrend.
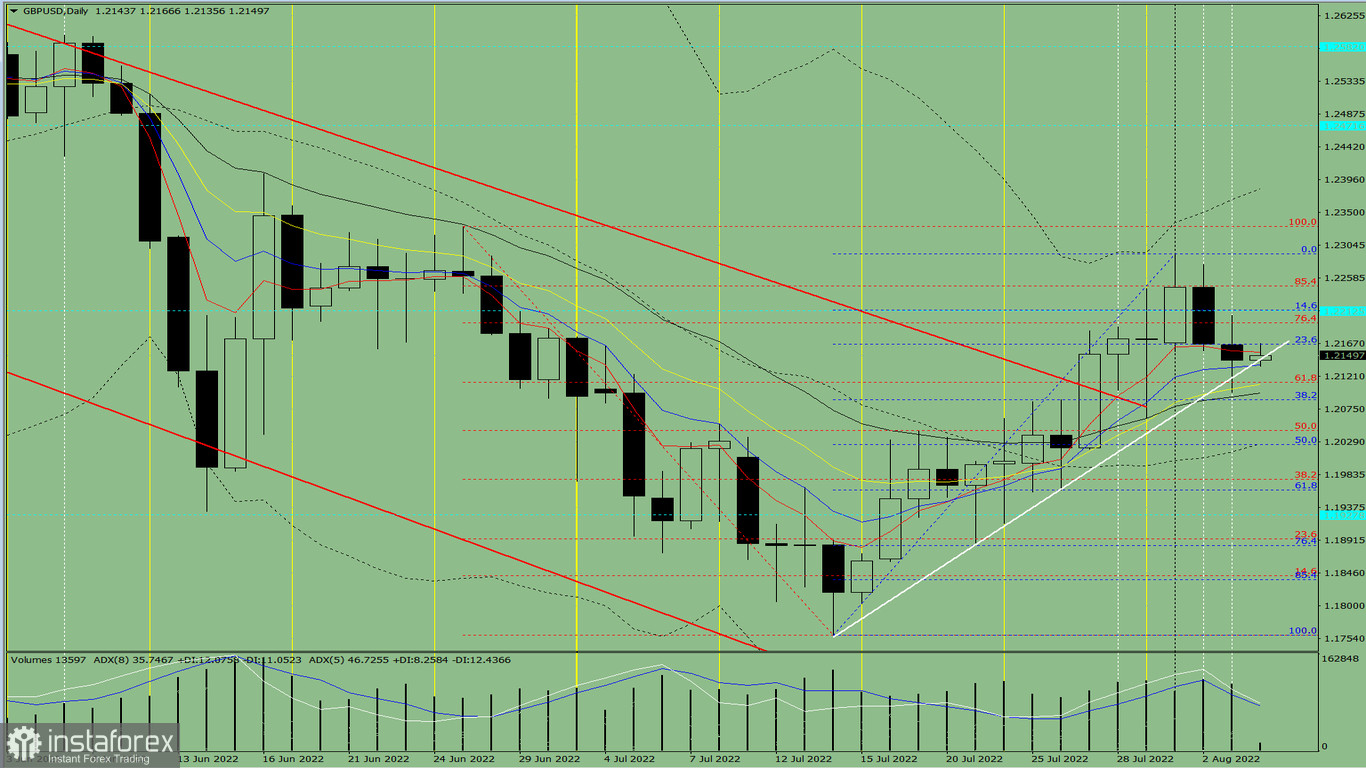
Fig. 1 (daily chart).
Complex analysis:
- indicator analysis - down
- Fibonacci levels - down
- volumes - down
- candlestick analysis - up
- trend analysis - up
- Bollinger bands - up
- weekly chart - up
Final thoughts:
On Thursday, the price may go up from the mark of 1.2144 (closing of yesterday's daily candlestick) to the 76.4% retracement level of 1.2196 (red dotted line). Should the quote test this mark, it may then rise to the 85.4% retracement level of 1.2247 (red dotted line) and extend the uptrend.
Alternative scenario: the price may go up from the mark of 1.2144 (closing of yesterday's daily candlestick) to the 76.4% retracement level of 1.2196 (red dotted line). Should the quote test this mark, a pullback may occur to the 38.2% retracement level of 1.2084 (blue dotted line), and then the uptrend could extend.


