GBP/USD 5M

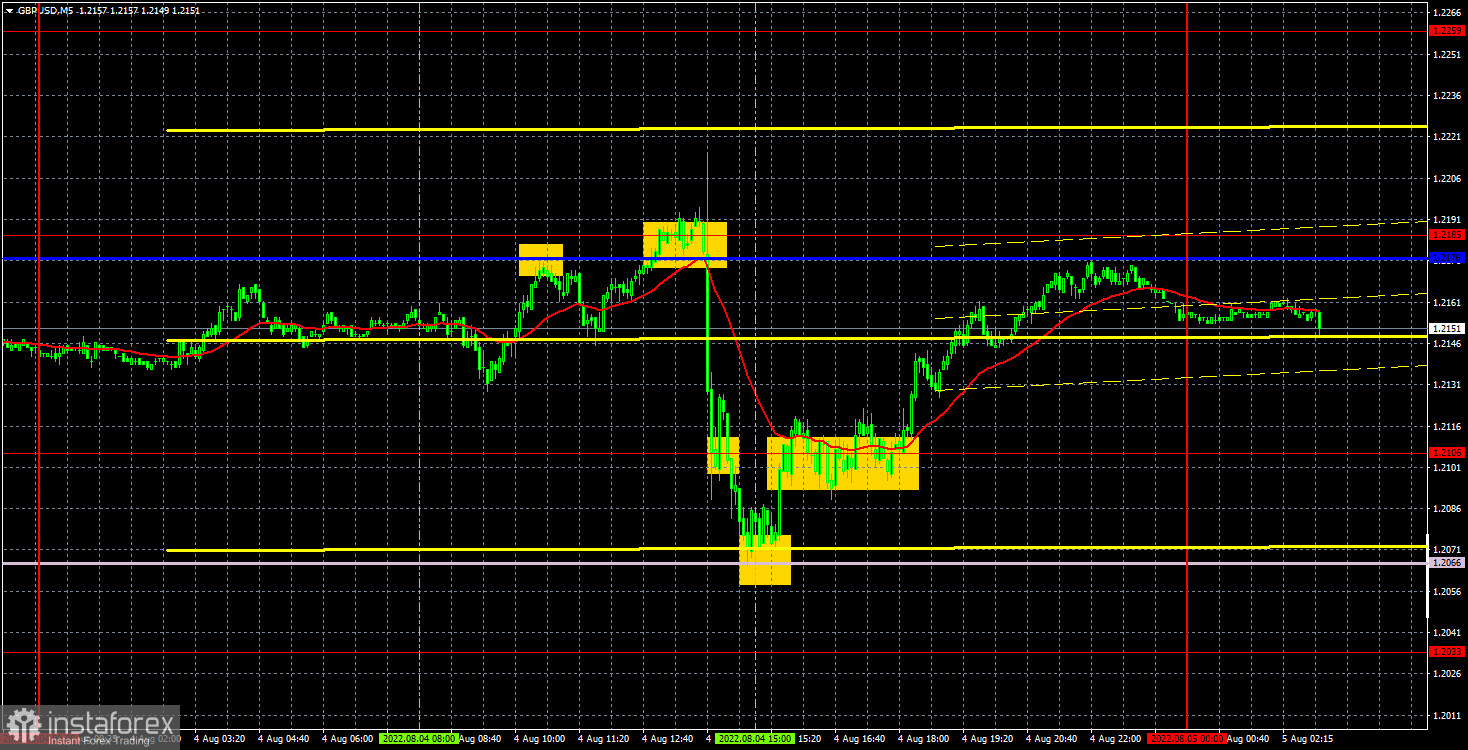
The GBP/USD currency pair did everything on Thursday. At first, the pair moved quite calmly with a minimal upward slope, so it fell sharply, then slowly recovered to the opening levels of the day. Thus, we were right when we said that following the Bank of England meeting, the pound is likely to fall. We also turned out to be right that we should not jump to conclusions based on the reaction of traders. As you can see, in the next few hours after the meeting, the pound grew. As for the results themselves, they turned out to be both banal and unexpected at the same time. The main thing is that the central bank raised the rate by 0.5%. Secondary - the central bank warned that from September it could begin to reduce its own balance by selling securities. Unexpected - BoE forecasts for the economy for the next two years. We talked about them in detail in fundamental articles. Thus, the main thing is that the pound showed that it worked out the results of the BoE meeting in advance, and also overcame the ascending trend line. At the end of Thursday, the pair remained between the Senkou Span B and Kijun-sen lines, but the situation may change, thanks to the US Nonfarm report. In general, we expect a new round of the fall of the British pound, as it has clearly exhausted all its growth factors.
Trading the pair on Thursday was very difficult and sometimes impossible. For example, the first trading signal should have been processed with a short position, but the deal was closed at breakeven by Stop Loss. Then another sell signal was formed, but it could hardly be worked out, since it was at this time that the announcement of the results of the BoE meeting began. The same applies to the third signal near the level of 1.2106. It was possible to try to work out only the last two signals. The rebound from the Senkou Span B line was quite strong and the pair almost immediately rose to the level of 1.2106. Breaking this level was gradual and inaccurate, so traders may not have waited for it. In general, a small profit could be made on Thursday.
COT report:

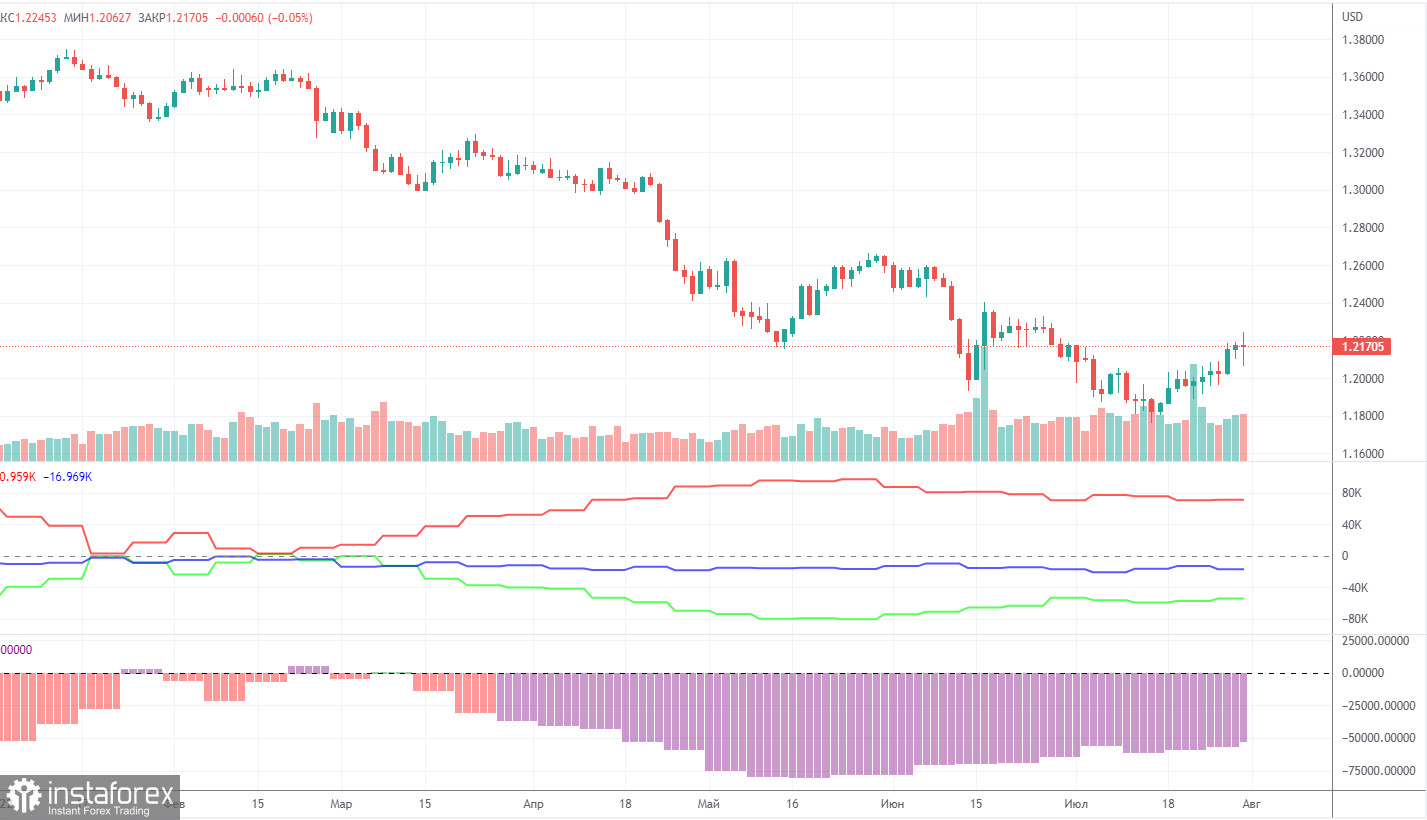
The latest Commitment of Traders (COT) report again showed insignificant changes. During the week, the non-commercial group opened 2,600 long positions and closed 600 shorts. Thus, the net position of non-commercial traders increased by 3,200. But what does it matter if the mood of the big players still remains "pronounced bearish", which is clearly seen in the second indicator in the chart above? To be fair, in recent months, the net position of the non-commercial group is still growing and the pound also shows some tendency to rise. However, both the growth of the net position and the pound are now very weak (in global terms), so it is still difficult to conclude that this is the beginning of a new upward trend, and the pound will no longer fall. We also said that the COT reports do not take into account the demand for the dollar, which is likely to remain very high right now. Therefore, in order to strengthen the British currency, the demand for it should grow faster and stronger than the demand for the dollar. The non-commercial group currently has a total of 89,000 shorts open and only 34,000 longs. The net position will have to show growth for a long time to at least equalize these figures. The Bank of England could provide theoretical support to the pound, as well as the technical need to be corrected from time to time. There is nothing more for the pound to count on now.
We recommend to familiarize yourself with:
Overview of the EUR/USD pair. August 5. Only the Nonfarm data remains to survive.
Overview of the GBP/USD pair. August 5. The Bank of England raised the rate by 0.5% and stunned the markets with its forecasts.
Forecast and trading signals for EUR/USD on August 5. Detailed analysis of the movement of the pair and trading transactions.
GBP/USD 1H

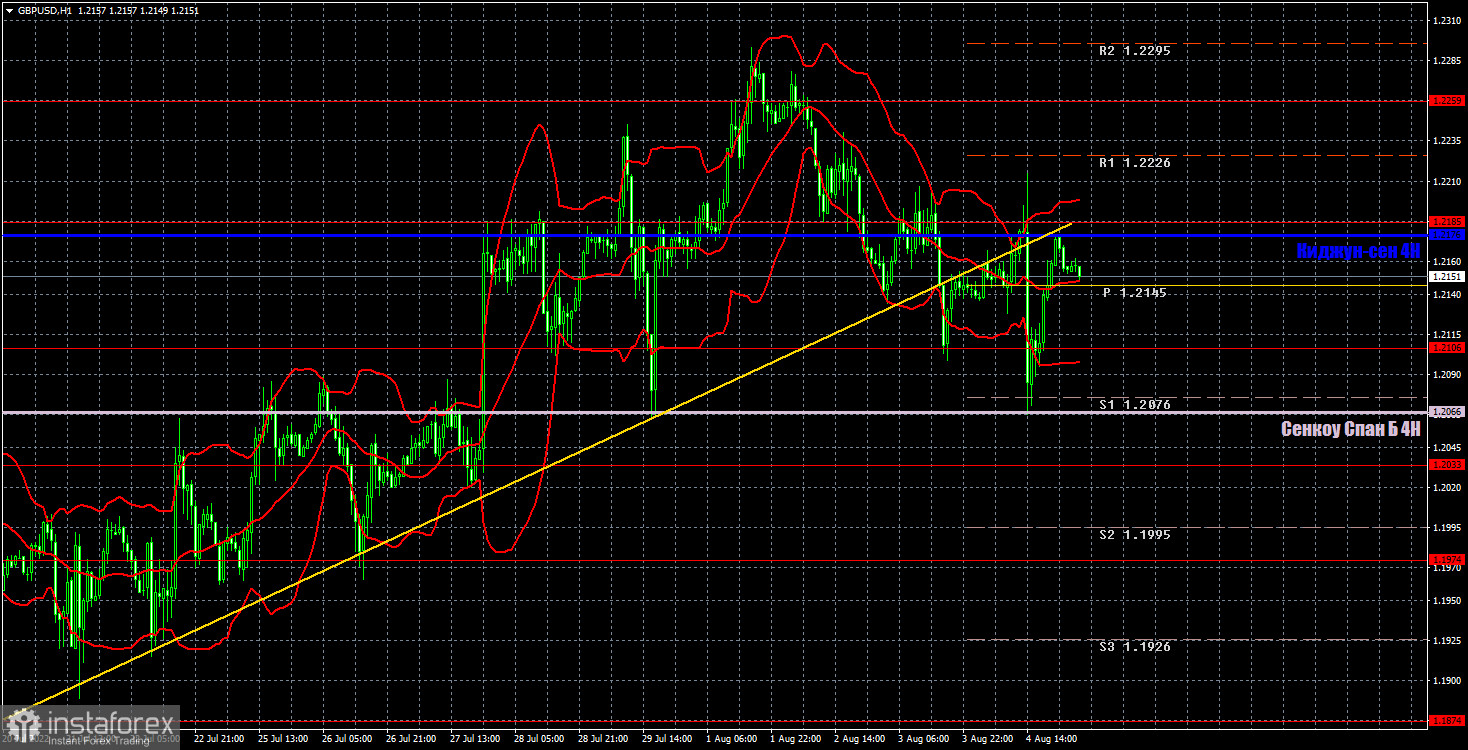
The pair has overcome the trend line on the hourly timeframe, so the upward trend has been canceled. Yesterday we already said that we need to wait for the official results of the BoE meeting, and today we will say that we need to wait for the final processing of these results and the NonFarm Payrolls report. The pound may still resume growth if the Nonfarm report turns out to be disappointing. But we are counting on a new fall. We highlight the following important levels for August 5: 1.1974, 1.2033, 1.2106, 1.2185, 1.2259, 1.2342, 1.2429. Senkou Span B (1.2066) and Kijun-sen (1.2176) lines can also be sources of signals. Signals can be "rebounds" and "breakthroughs" of these levels and lines. The Stop Loss level is recommended to be set to breakeven when the price passes in the right direction by 20 points. Ichimoku indicator lines can move during the day, which should be taken into account when determining trading signals. The chart also contains support and resistance levels that can be used to take profits on trades. Nothing interesting is planned for Friday in the UK. Everything interesting will be in America. In particular, reports on unemployment and Nonfarm. Looks like we're in for another fun day.
Explanations for the chart:
Support and Resistance Levels are the levels that serve as targets when buying or selling the pair. You can place Take Profit near these levels.
Kijun-sen and Senkou Span B lines are lines of the Ichimoku indicator transferred to the hourly timeframe from the 4-hour one.
Support and resistance areas are areas from which the price has repeatedly rebounded off.
Yellow lines are trend lines, trend channels and any other technical patterns.
Indicator 1 on the COT charts is the size of the net position of each category of traders.
Indicator 2 on the COT charts is the size of the net position for the non-commercial group.


