Today, the focus of investors' attention will be on the US Department of Labor's monthly labor market report at 12:30 (GMT) and Statistics Canada's report on the Canadian labor market.

In one of my previous reviews, I noted that the annual consumer price index (CPI) rose in May to +7.7%, the highest level in 39 years, and in June exceeded this level, reaching 8.1%. At the same time, unemployment is also expected to rise in July to 5.1% (previously at 4.9%). The deterioration of the situation on the labor market will significantly exacerbate the Bank of Canada's problem of curbing rising inflation while the labor market and the country's economy are slowing down.

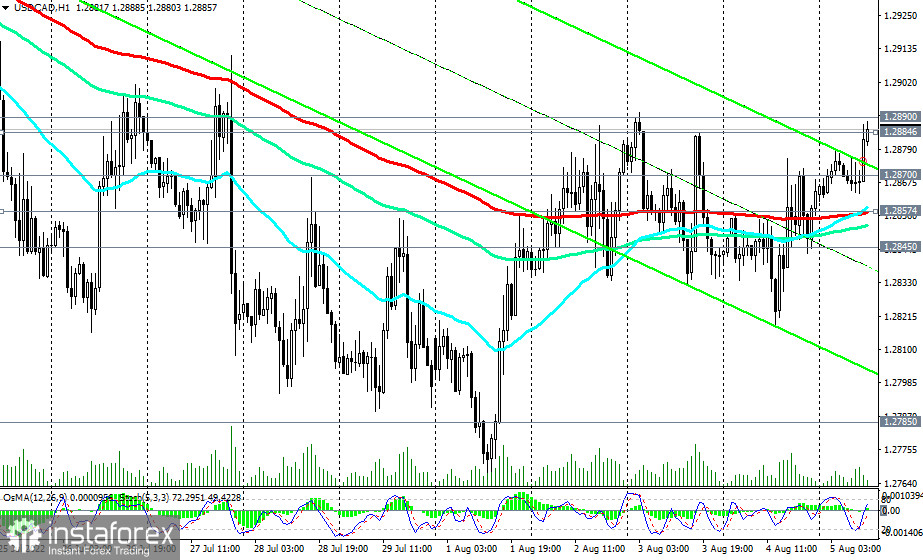
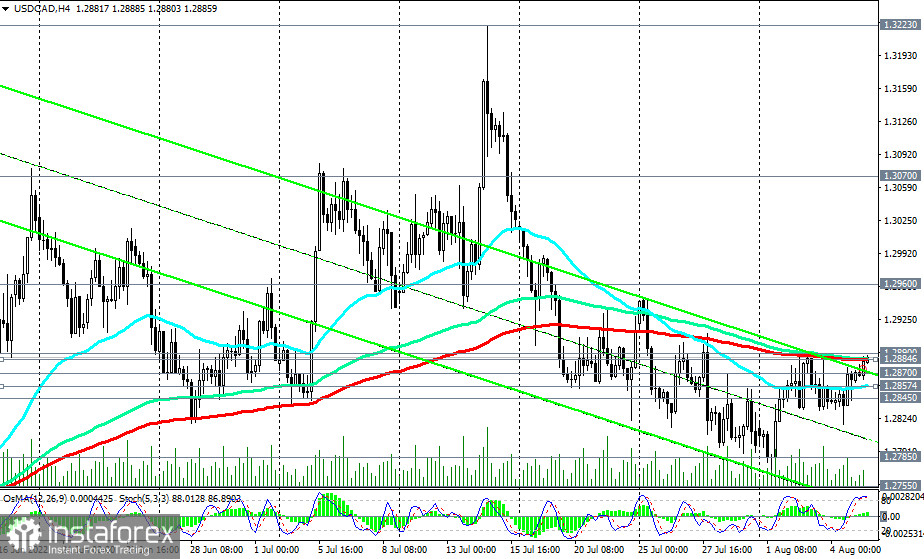
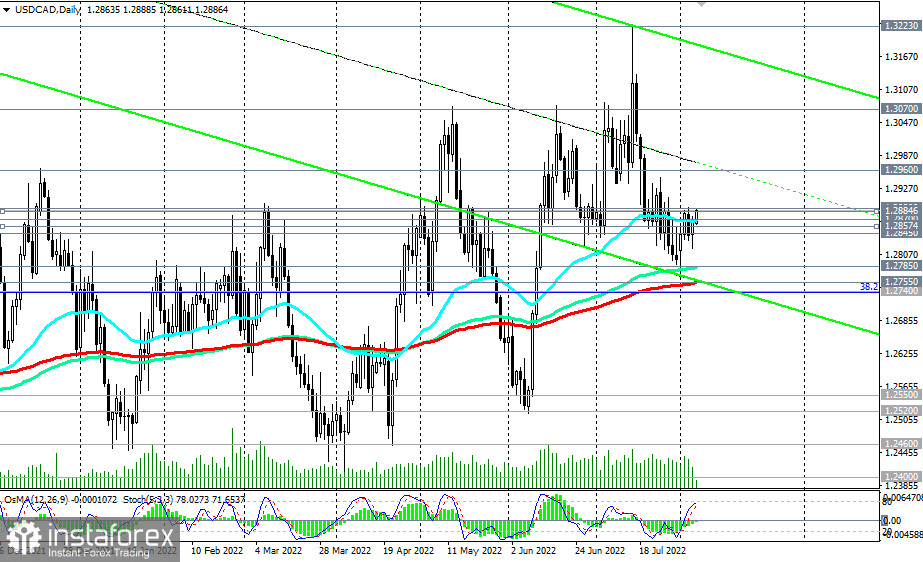
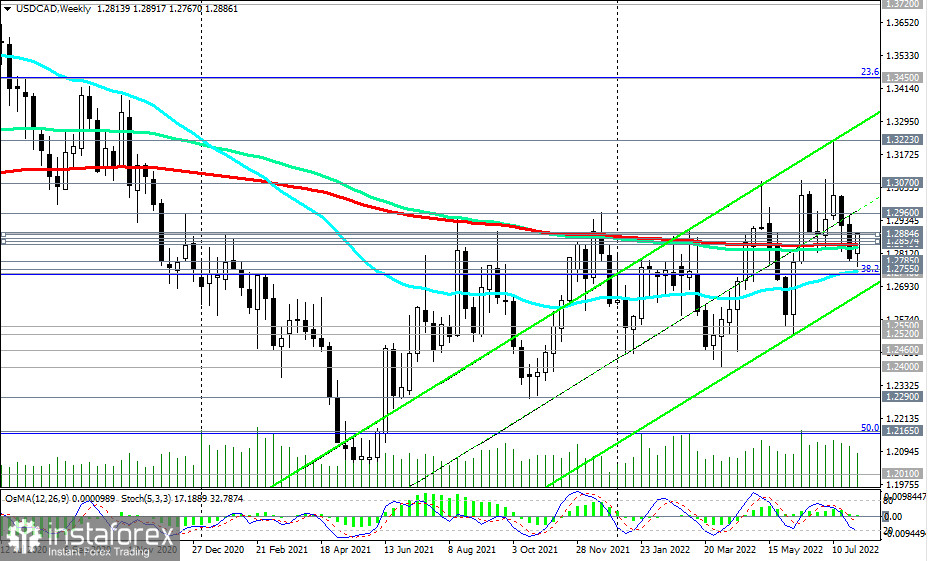
From a technical point of view, USD/CAD is in the bull market zone, above the key support levels 1.2850 (200 EMA on the weekly chart), 1.2785 (144 EMA on the daily chart), 1.2755 (200 EMA on the daily chart).
Today's publication at 12:30 (GMT) may become a driver for further growth if the data for the US turns out to be positive and for Canada—negative.

The breakdown of the local resistance level of 1.2890 will be a confirmation signal for new long positions in USD/CAD.
In an alternative scenario, and after the breakdown of support levels 1.2857 (200 EMA on the 1-hour chart), 1.2845 (local support level), USD/CAD will head towards key support levels 1.2755, 1.2740 (38.2% Fibonacci retracement of the downward correction in the USD/ CAD from 0.9700 to 1.4600). Their breakdown will return USD/CAD to the bear market zone.
Support levels: 1.2870, 1.2857, 1.2845, 1.2800, 1.2785, 1.2755, 1.2740, 1.2700, 1.2550, 1.2520
Resistance levels: 1.2890, 1.2960, 1.3000, 1.3070, 1.3100, 1.3223
Trading Tips
Sell Stop 1.2860. Stop-Loss 1.2910. Take-Profit 1.2845, 1.2800, 1.2785, 1.2755, 1.2740, 1.2700, 1.2550, 1.2520
Buy Stop 1.2910. Stop-Loss 1.2860. Take-Profit 1.2960, 1.3000, 1.3070, 1.3100, 1.3223


