GBP/USD 5M

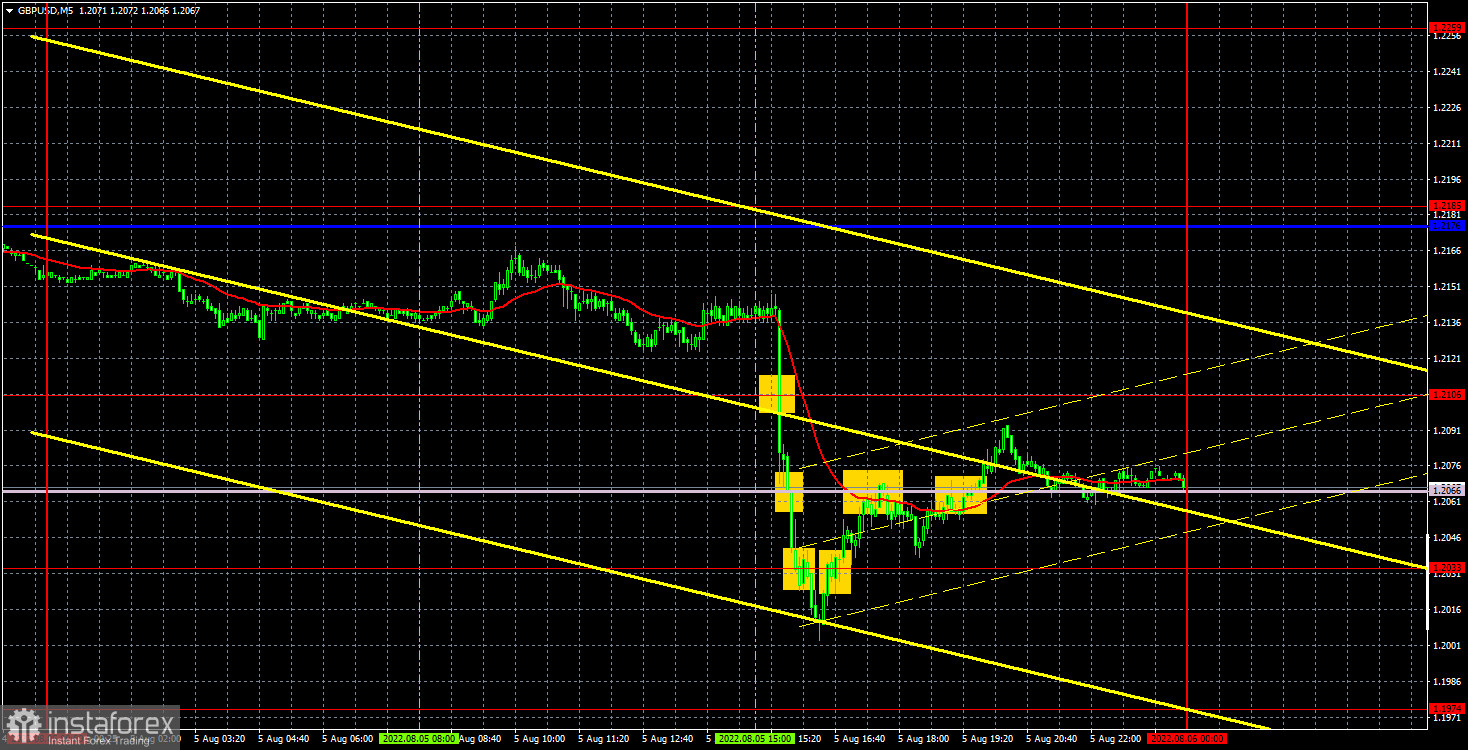
The GBP/USD currency pair traded almost identically to the EUR/USD pair on Friday. There was practically no movement (as well as important events in the UK) during the European trading session, but at the very beginning of the US session, the British pound quotes fell. Naturally, it would be more correct to say "the dollar soared", since the US currency began to rise in price amid strong statistics from overseas. But the meaning of the change in the places of the terms does not change. The pair fell hard for the third consecutive time and so far it has been saved by quick upward rollbacks. For example, the pound fell by 145 points on Friday, but by the end of the day managed to recover by about half. From our point of view, the key moment now is to overcome the rising trend line on the hourly timeframe, which has supported the pound's growth for a long time. The trend has now changed to a downward trend, traders have already worked out the increase in the Bank of England rate by 0.5%, so now nothing prevents the bears from getting down to business again and starting active short positions. We believe that at this stage the euro and the pound have exhausted their corrective potential.
As for trading signals, there were not a single one at the European session, and the first three at the US session should have been ignored, since they were formed with an interval of 10-15 minutes exactly at the time when the most important reports on Nonfarm and unemployment were published. It was possible to try to work out only the first buy signal near the level of 1.2033 and the next sell signal near Senkou Span B. But neither the first nor the second brought traders the expected level of profit. It was possible to earn 10 points on the first deal, the second one had to be manually closed at breakeven. As a result, the day ended with minimal profit, despite the ultra-high volatility of the pair.
COT reports:

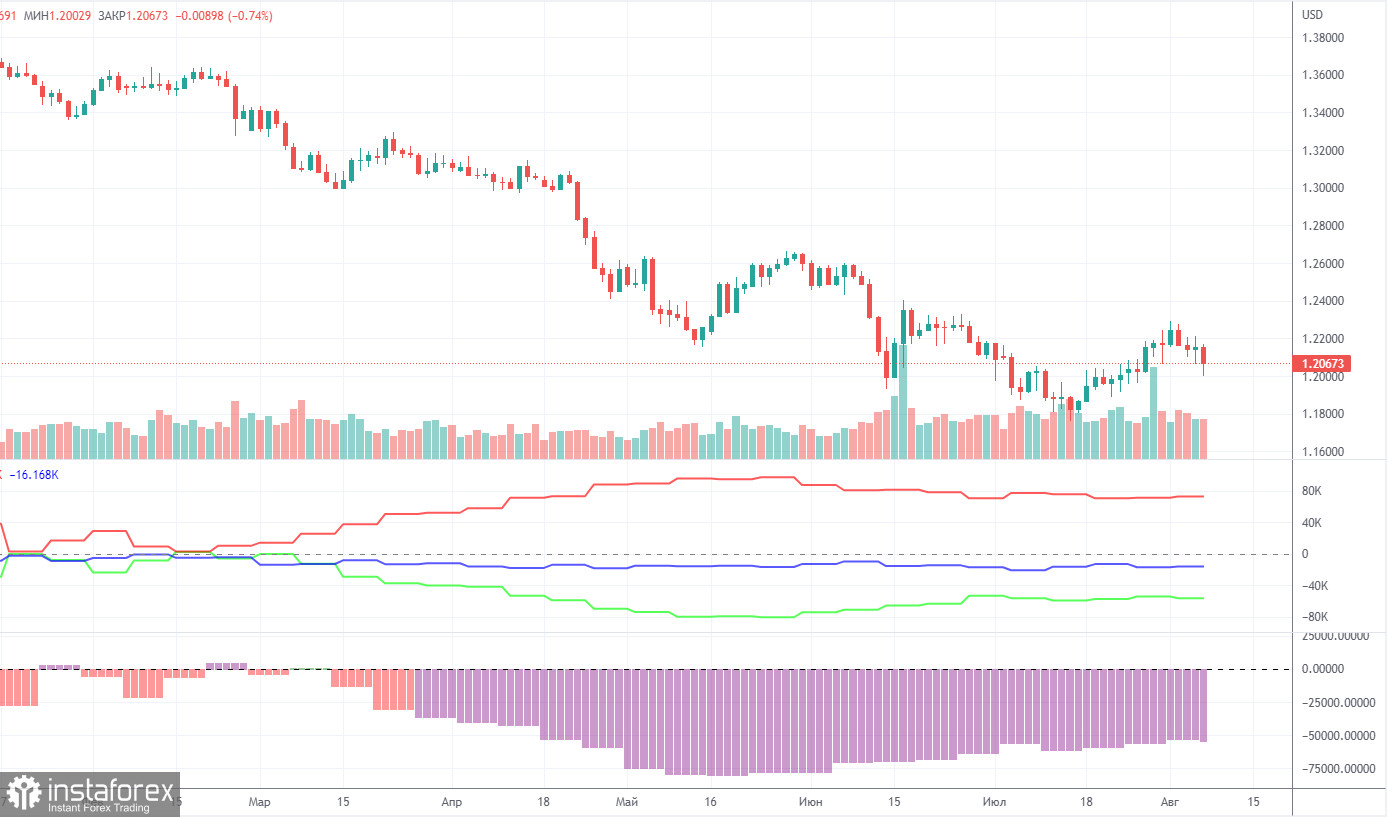
The latest Commitment of Traders (COT) report again showed insignificant changes. During the week, the non-commercial group closed 5,300 long positions and 2,900 short positions. Thus, the net position of non-commercial traders decreased by 2,400. But what does it matter, if the mood of the big players still remains "pronounced bearish", which is clearly seen in the second indicator in the chart above (purple bars below zero = bearish mood)? To be fair, in recent months, the net position of the non-commercial group is still growing and the pound also shows some tendency to grow. However, both the growth of the net position and the pound's growth are now so weak (in global terms), so it is still difficult to conclude that this is the beginning of a new upward trend. It is rather difficult to call the current growth even a "correction". We also said that the COT reports do not take into account the demand for the dollar, which is likely to remain very high right now. Therefore, to strengthen the British currency requires that the demand for it grows faster and stronger than the demand for the dollar. And on the basis of what factors is the demand for the pound growing now?
The non-commercial group currently has a total of 86,000 short positions open and only 29,000 long positions. The net position will have to show growth for a long time to at least equalize these figures. Theoretical support can be provided to the pound by the technical need to be corrected from time to time. There is nothing more for the British currency to count on now.
We recommend to familiarize yourself with:
Overview of the EUR/USD pair. August 8. The week will be boring, but perhaps this is exactly what is needed to complete the flat?
Overview of the GBP/USD pair. August 8. Has the market already decided on a new trend? Or should we wait for the US inflation report?
Forecast and trading signals for EUR/USD on August 8. Detailed analysis of the movement of the pair and trading transactions.
GBP/USD 1H

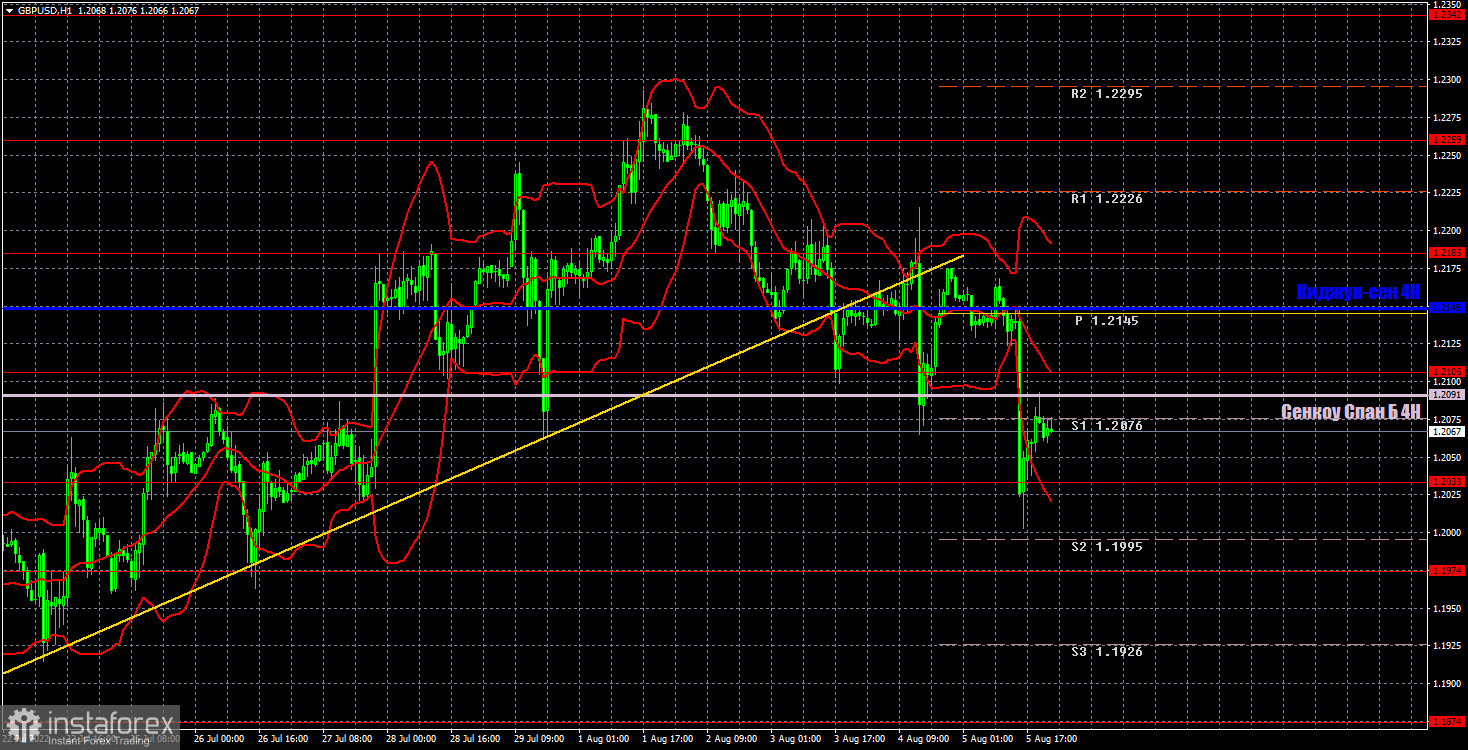
The pair has overcome the trend line on the hourly timeframe, so the upward trend has been canceled. As we expected after the major events in the US and UK, the pound began a new fall, and we believe that it will continue in the coming weeks. So far, there is no trend line or channel, however, the price has settled below the Senkou Span B line, so the probability of further decline is high. We highlight the following important levels on August 8: 1.1874, 1.1974, 1.2033, 1.2106, 1.2185, 1.2259. Senkou Span B (1.2091) and Kijun-sen (1.2149) lines can also be sources of signals. Signals can be "rebounds" and "breakthroughs" of these levels and lines. The Stop Loss level is recommended to be set to breakeven when the price passes in the right direction by 20 points. Ichimoku indicator lines can move during the day, which should be taken into account when determining trading signals. The chart also contains support and resistance levels that can be used to take profits on trades. There are no interesting events or reports scheduled for Monday in the UK and US. However, the average volatility of the pair remains very high, so we are waiting for new strong trend movements.
Explanations for the chart:
Support and Resistance Levels are the levels that serve as targets when buying or selling the pair. You can place Take Profit near these levels.
Kijun-sen and Senkou Span B lines are lines of the Ichimoku indicator transferred to the hourly timeframe from the 4-hour one.
Support and resistance areas are areas from which the price has repeatedly rebounded off.
Yellow lines are trend lines, trend channels and any other technical patterns.
Indicator 1 on the COT charts is the size of the net position of each category of traders.
Indicator 2 on the COT charts is the size of the net position for the non-commercial group.


