


GOLD:
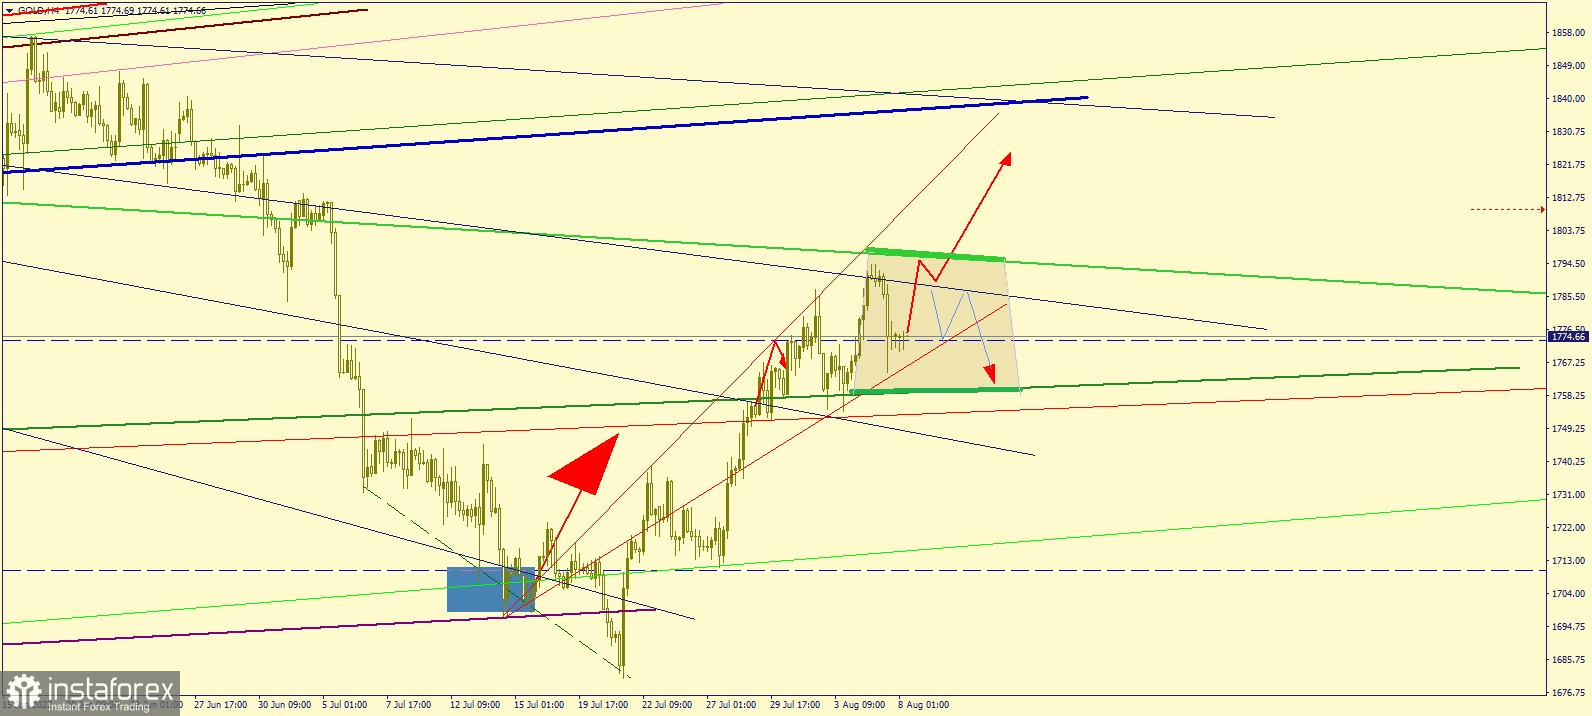
The chart shows the movement of gold in the four-hour (H4) chart.
Comparing the recent movement to that of July 13 and July 28's, it is obvious that gold prices are growing, and it is likely that a new high will be reached this week.
These two scenarios are possible:
1. A breakdown of the resistance area (sloping green line), which is in the range of $1797-1800. That would immediately push gold to $1,837 per 1 troy ounce.
2. A decrease to $1775 (as shown on the chart), then a new attempt to overcome the resistance area. After that will be a downward correction towards $1,760.
In other words, the movement of gold will strongly depend on the fundamental factors in the market.


