


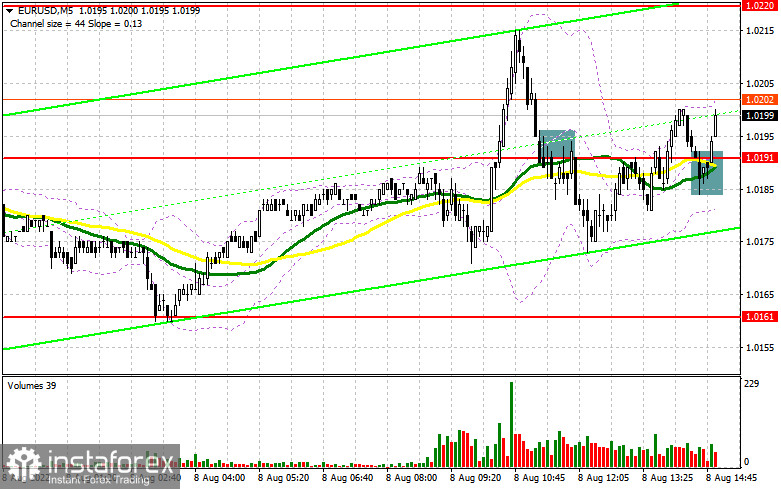
In the morning article, I highlighted the level of 1.0191 and recommended making decisions with this level in focus. Now let's look at the 5-minute chart and try to figure out what actually happened. Taking into account that the economic calendar remained empty in the first half of the day, the price failed to consolidate above 1.0191 following a downward test and a breakout. It led to a sell signal. However, the price avoided a sharp fall within Friday's downtrend. After a decline by 17 pips, demand for the euro returned. In the afternoon, the bulls managed to push the price to 1.0191. A buy signal appeared at the time of writing the article.
What is needed to open long positions on EUR/USD
As long as trading is carried out above 1.0191, the euro may resume an upward movement. The 1.0191 level is located in the middle of the morning sideways channel. Given that the economic calendar is uneventful in the afternoon, the pair could start rising. However, in my opinion, this scenario will hardly take place. The volatility is likely to be very low. For this reason, the price will be unable to approach the morning high. In case of a decline, only a false breakout of 1.0187 will give a new buy signal as the euro has already bounced off this level today. After that, the pair may cement an uptrend and climb to the resistance level of 1.0214. A breakout and a downward test of this level will force the bears to close their Stop-Loss orders, providing an additional buy signal. If so, a larger upward movement to 1.0238 may occur. The distant target will be the 1.0264 level where I recommend locking in profits. If EUR/USD slides down and buyers show no activity at 1.0187, the pressure on the pair will escalate, pushing it to 1.0161. After that, the price could decrease to 1.0124, which is the lower border of the sideways channel. The best option for opening long positions would be a false breakout of these levels. You can buy EUR/USD immediately at a bounce from 1.0082 or even a low of 1.0045, keeping in mind an upward intraday correction of 30-35 pips.
What is needed to open short positions on EUR/USD
The bears exhibited strength in the morning, pushing the bulls off the market. However, large sellers are not in a hurry to enter the market. Therefore, the bearish pressure on the pair is rather weak compared to Friday after the release of NFP data. It would be appropriate to open short positions after a false breakout of the resistance level of 1.0214. This level is also an intraday high. If this scenario comes true, the euro may drop to 1.0187. A breakout of this level, as well as an upward test, will provide an additional sell signal. The bulls will have to close their Stop-Loss orders. As a result, the pair is expected to sink to 1.0161. If it declines below this level, it will open the way to 1.0124 where I recommend closing all short positions. A more distant target will be the 1.0082 level. If EUR/USD grows during the American session and the bears show no energy at 1.0214, the bear trend, which started on Friday, is likely to end. If so, it is better to postpone short positions to 1.0238. A false breakout of this level will generate an additional sell signal. You can sell EUR/USD immediately at a bounce of 1.0264 or a high of 1.0323, keeping in mind a downward intraday correction of 30-35 pips.
COT report
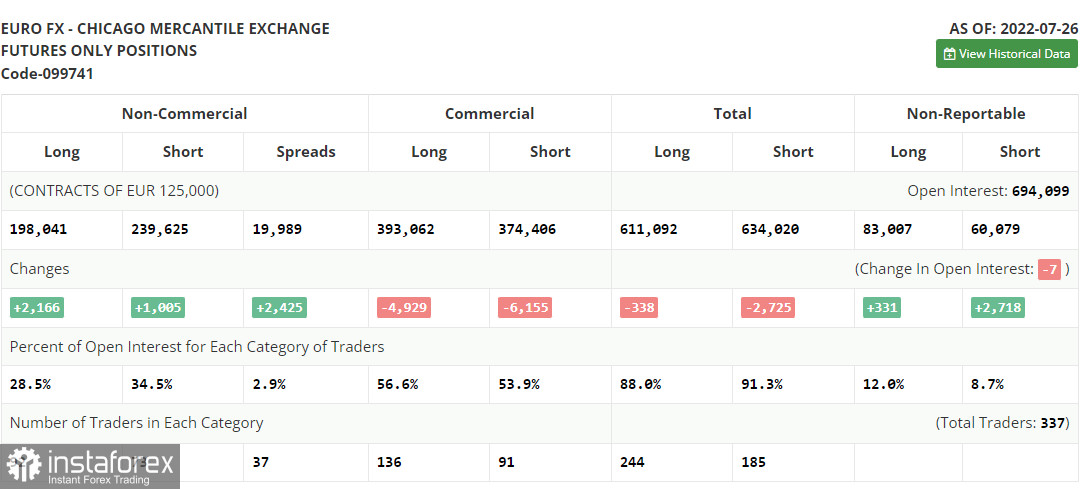
According to the COT report from July 26, the number of both long and short positions increased. However, the number of long ones turned out to be bigger, reflecting a gradual end of the bear market and an attempt to find the bottom after reaching the parity level. The euro advanced amid economic reports from the EU released last week. A slight acceleration in inflation was eclipsed by a sharp growth of the European economy in the second quarter of this year. GDP rose by 4.0 on a yearly basis, surprising economists. It also facilitated the bullish sentiment after the Fed hinted at a possible slowdown in monetary tightening. To this end, the EUR/USD pair is likely to approach new highs. The COT report revealed that the number of long non-commercial positions increased by 2,166 to 198,041, while the number of short non-commercial positions jumped by 1,005 to 239,625. At the end of the week, the total non-commercial net position remained negative. Yet, it rose slightly to -41,584 from -42,745. The weekly closing price dropped to 1.0161 from 1.0278.
Signals of technical indicators
Moving averages
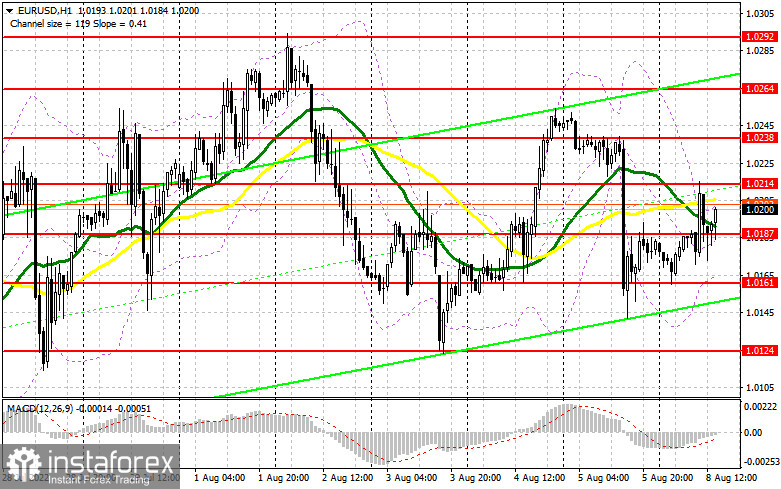
EUR/USD is trading near 30- and 50-period moving averages, indicating market uncertainty.
Remark. The author is analyzing a period and prices of moving averages on the 1-hour chart. So, it differs from the common definition of classic daily moving averages on the daily chart.
Bollinger Bands
In case of a rise, the upper border of 1.0200 will act as resistance. In case of a decline, the lower border of 1.0161 will act as support.
Definitions of technical indicators
- Moving average recognizes an ongoing trend through leveling out volatility and market noise. A 50-period moving average is plotted yellow on the chart.
- Moving average identifies an ongoing trend through leveling out volatility and market noise. A 30-period moving average is displayed as the green line.
- MACD indicator represents a relationship between two moving averages that is a ratio of Moving Average Convergence/Divergence. The MACD is calculated by subtracting the 26-period Exponential Moving Average (EMA) from the 12-period EMA. A 9-day EMA of the MACD called the "signal line".
- Bollinger Bands is a momentum indicator. The upper and lower bands are typically 2 standard deviations +/- from a 20-day simple moving average.
- Non-commercial traders - speculators such as retail traders, hedge funds and large institutions who use the futures market for speculative purposes and meet certain requirements.
- Non-commercial long positions represent the total long open position of non-commercial traders.
- Non-commercial short positions represent the total short open position of non-commercial traders.
- The overall non-commercial net position balance is the difference between short and long positions of non-commercial traders.


