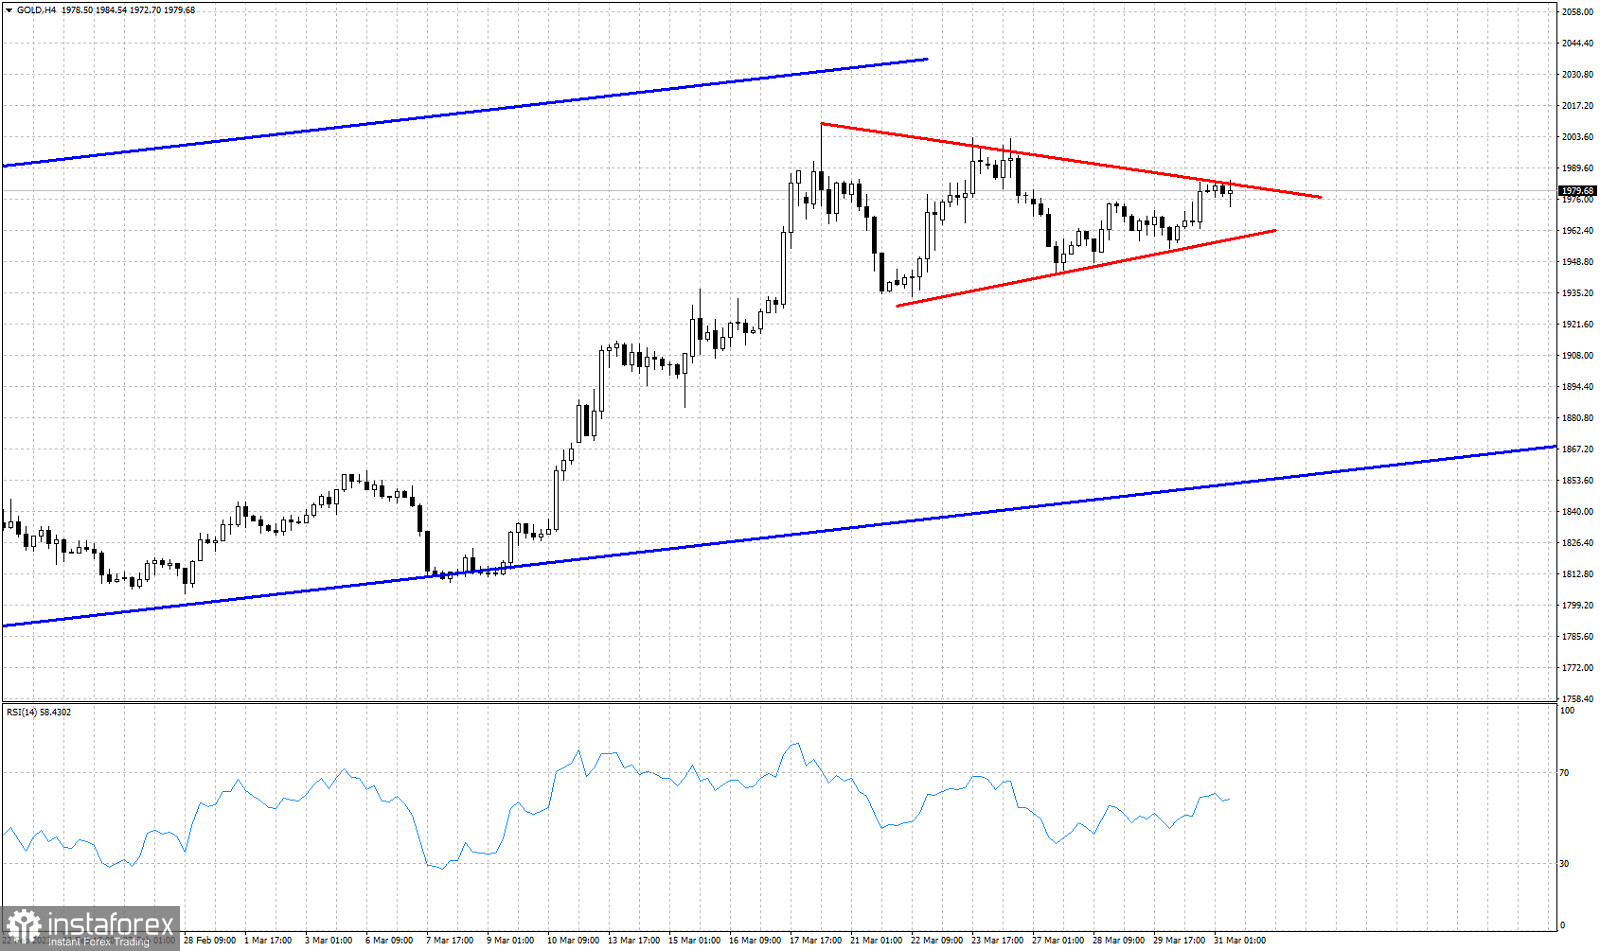
Blue lines- bullish channel
Red lines- triangle pattern
Gold price is trading around $1,979. Price remains inside the triangle pattern we mentioned in our previous analysis. Price has reached the short-term resistance level of $1,983 where we find the upper triangle boundary. A rejection at current levels will imply that a pull back towards the lower triangle boundary is very probable. Support by the triangle lower boundary is at $1,958. Gold remains inside the upward sloping blue channel. Trend remains bullish despite the near term indecisiveness. Triangles are usually found in the final stages of trends. Breaking to the upside has more chances than breaking to the downside. Target is around $2,060 but we should not forget that this might be a final push higher.


