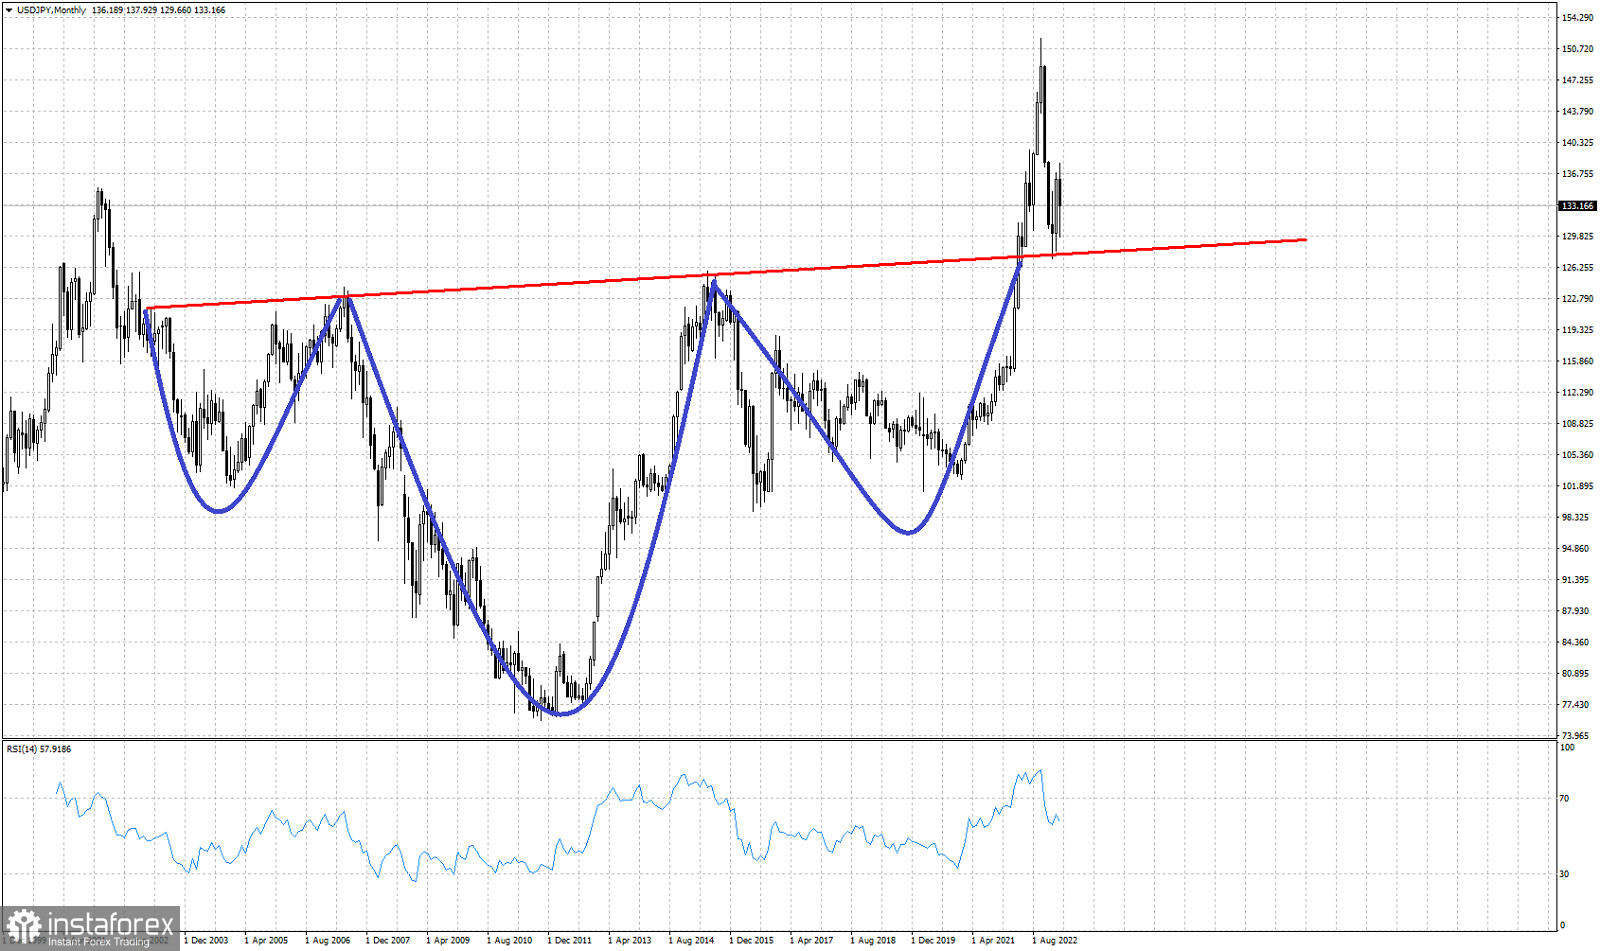
Red line - neckline resistance
Blue lines- Head and shoulders pattern
In previous posts we have talked about the major bullish pattern of the inverted head and shoulders pattern in USDJPY. We have posted the monthly chart several times even before the break out above the neckline resistance. Since the first reversal signs after the top of 151.96, we mentioned many times that a back test of the neckline was expected. The neckline (red line) used to be resistance and is now support. Price back tested it and is bouncing off this support trend line. Current price action is bullish for the long-term. Bulls do not want to see price break below the red trend line at 127.70. As long as this is the case, we will remain bullish and the inverted head and shoulders pattern active. We will be expecting the next leg higher above 152.


