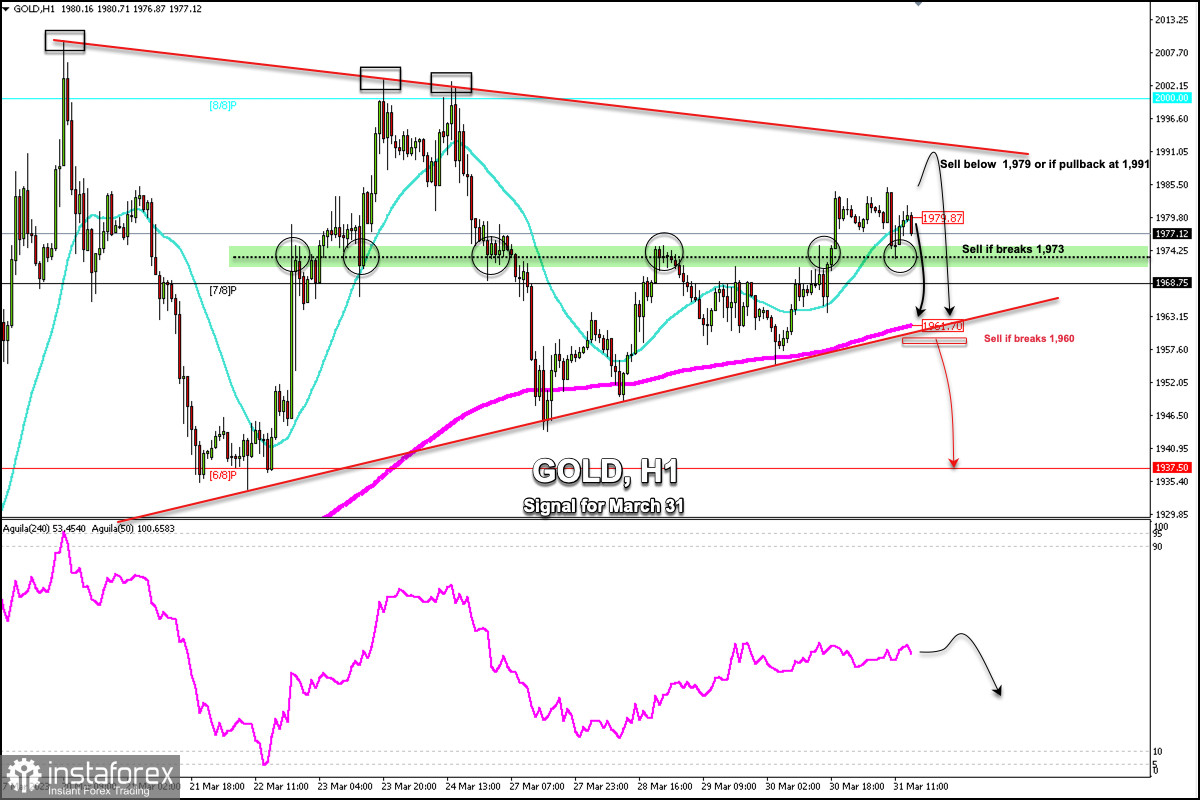
Early in the American session, Gold (XAU/USD) is trading around 1,977.12, below the 21 SMA, and above the 200 EMA. We can see that the bullish force still prevails but the price could be facing a resistance zone which could lead to a change in the trend.
According to the 1-hour chart, we can see that gold has a key resistance zone around 1,991. This level has been traced from the high of 2009, 2003, and 2002. In case gold approaches this resistance zone, we expect the signal to sell to be activated.
On the other hand, in case XAU/USD breaks the daily pivot point located at 1,973, we could expect the bearish movement to accelerate which will push the price to the 200 EMA located at 1,961.70.
In the chart above, we can observe a symmetrical triangle formation. The break below 1,960 could confirm a bearish movement in the short. In the medium term, the price could fall towards 1,937 (6/8 Murray) and to the psychological level of 1,900.
Conversely, if gold consolidates above 1,990, the bull cycle is likely to extend and the instrument could climb to 8/8 Murray at $2,000 and ultimately it could reach +1/8 Murray located at 2,031.
As long as gold trades above 1,970, there is a chance it will continue to rise and the price could move closer to the key level of 1,991. A pullback to this area could be seen as a signal to sell, with targets at 1,961 and 1,937.
Our trading plan for the next few hours is to sell below 1,979 (21 SMA). In case of a pullback to 1,991, we could continue selling with targets at 1,961 and 1,937 (6/8 Murray).


