GBP/USD 5M

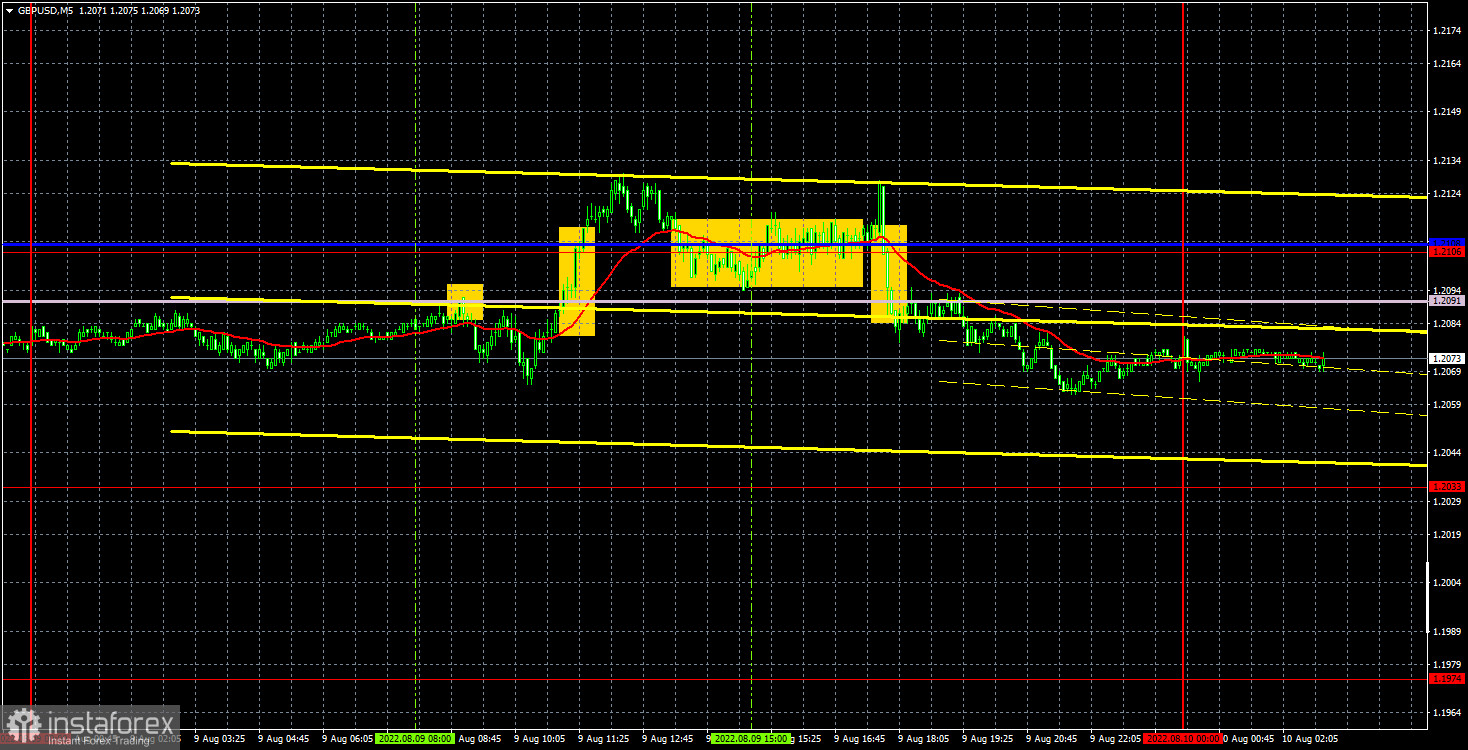
On Tuesday, the GBP/USD currency pair remained below the important lines of the Ichimoku Senkou Span B and Kijun-sen indicator, but did not show any interesting movement during the day. If earlier the pound/dollar pair was regularly trading volatile and trendy even with an empty calendar of macroeconomic events, now the desire of traders to trade almost from scratch has greatly diminished. No matter how the pound followed the euro's example and went flat. However, it is still too early to panic, as the pair only stood in one place for two days. Previously, it overcame the ascending trend line, so now a new downward trend is maintained. And the downward movement has not been canceled, as it might seem after Monday and Tuesday. Today we are waiting for the resumption of the fall of the British pound and expect that the US inflation report will help it in this. Naturally, it is not a fact that everything will be exactly like this, but even if the report provokes the pound's growth, then it will be able to settle above the Ichimoku indicator lines, which is also good, as it will signal a possible resumption of the upward trend.
As for trading signals, they were all bad on Tuesday. The pair spent the whole day near the Senkou Span B and Kijun-sen lines, which should be considered as an area, and regularly passed this area. We observed the purest flat within a single day. Well, let's figure it out. Traders could work out the first signal to sell, but the price could not go down 20 points, so the deal had to close at a loss. The next buy signal also turned out to be false, and the price again did not go in the right direction by even 20 points. Therefore, this transaction closed at a loss. Unfortunately. The next two trading signals were no better than the first two, but they should not have been worked out. As a result, the day turned out to be unsuccessful, one can only hope that the pound will not get stuck in a flat for a long time.
COT report:

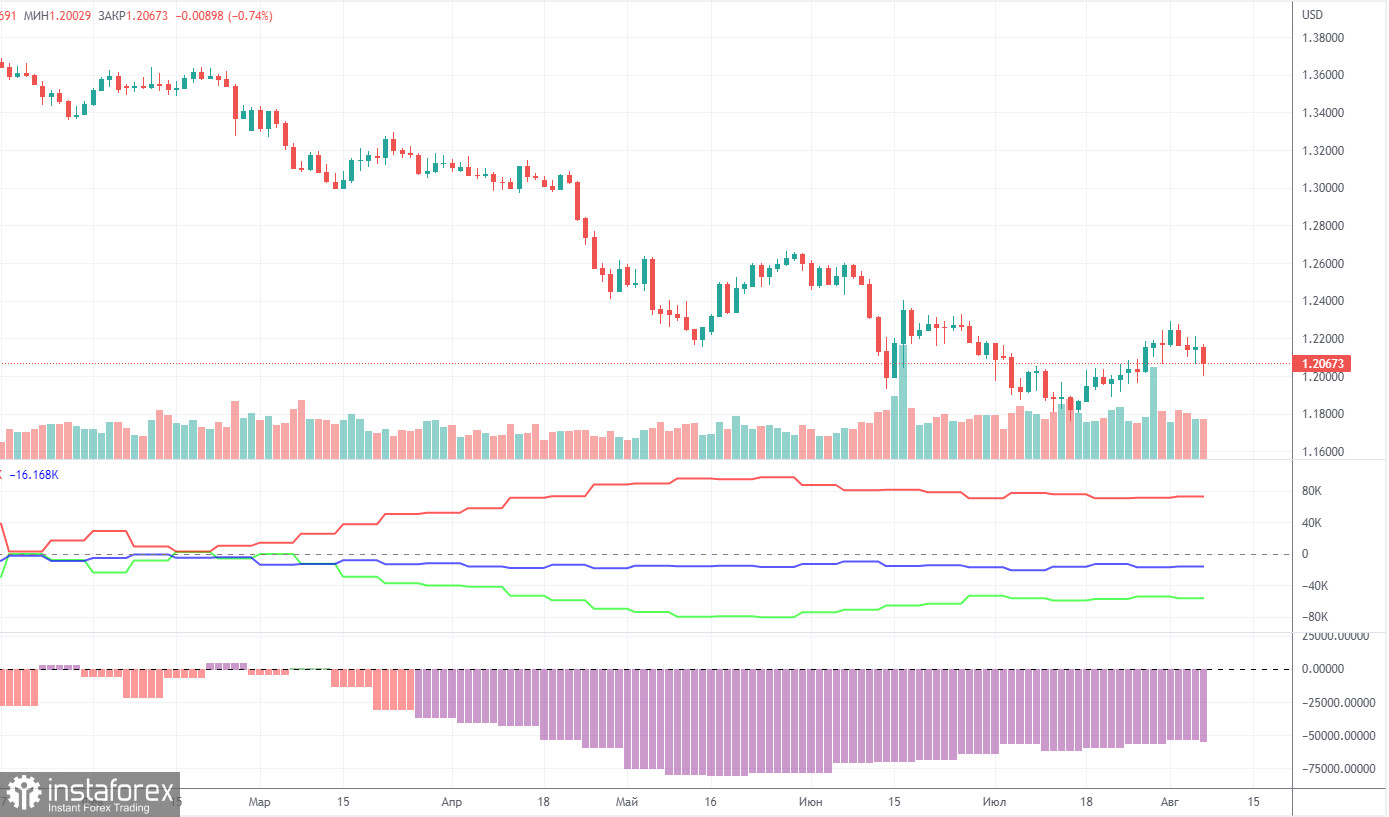
The latest Commitment of Traders (COT) report again showed insignificant changes. During the week, the non-commercial group closed 5,300 long positions and 2,900 short positions. Thus, the net position of non-commercial traders decreased by 2,400. But what does it matter, if the mood of the big players still remains "pronounced bearish", which is clearly seen in the second indicator in the chart above (purple bars below zero = bearish mood)? To be fair, in recent months, the net position of the non-commercial group is still growing and the pound also shows some tendency to grow. However, both the growth of the net position and the pound's growth are now so weak (in global terms), so it is still difficult to conclude that this is the beginning of a new upward trend. It is rather difficult to call the current growth even a "correction". We also said that the COT reports do not take into account the demand for the dollar, which is likely to remain very high right now. Therefore, to strengthen the British currency requires that the demand for it grows faster and stronger than the demand for the dollar. And on the basis of what factors is the demand for the pound growing now?
The non-commercial group currently has a total of 86,000 short positions open and only 29,000 long positions. The net position will have to show growth for a long time to at least equalize these figures. The pound can provide theoretical support through the technical need to be corrected from time to time. There is nothing more for the British currency to count on now.
We recommend to familiarize yourself with:
Overview of the EUR/USD pair. August 10. The European Union fears a gas war with Russia, so it is working on various plans.
Overview of the GBP/USD pair. August 10. The pound has several growth factors, but the dollar's positions still look stronger.
Forecast and trading signals for EUR/USD on August 10. Detailed analysis of the movement of the pair and trading transactions.
GBP/USD 1H

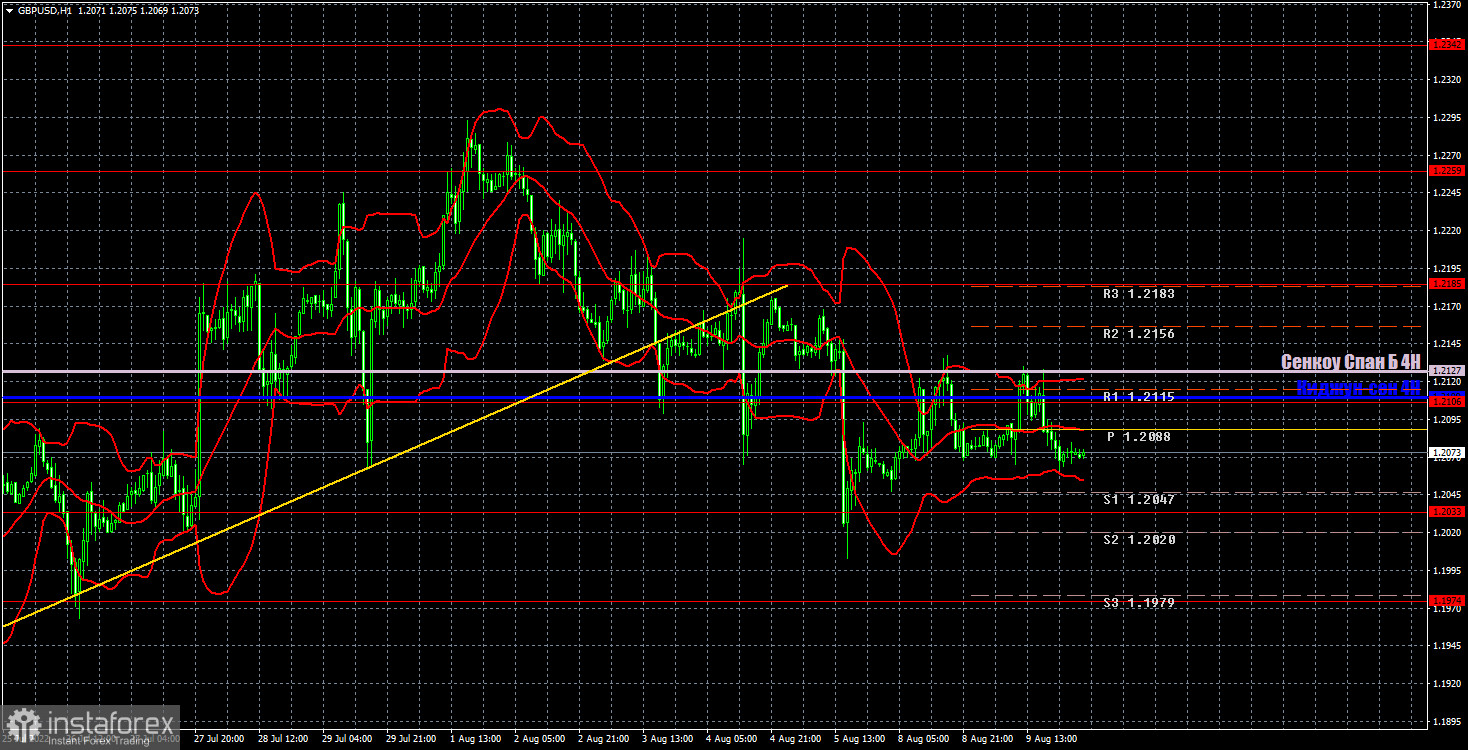
The pair has overcome the trend line on the hourly timeframe, so the upward trend has been canceled. As we expected after the major events in the US and UK, the pound began a new fall, and we believe that it will continue in the coming weeks. So far, there is no trend line or channel, however, the price is below the Kijun-sen and Senkou Span B lines, so the probability of further decline is high. We highlight the following important levels on August 10: 1.1874, 1.1974, 1.2033, 1.2106, 1.2185, 1.2259. Senkou Span B (1.2127) and Kijun-sen (1.2109) lines can also be sources of signals. Signals can be "rebounds" and "breakthroughs" of these levels and lines. The Stop Loss level is recommended to be set to breakeven when the price passes in the right direction by 20 points. Ichimoku indicator lines can move during the day, which should be taken into account when determining trading signals. The chart also contains support and resistance levels that can be used to take profits on trades. Again, no interesting events or reports scheduled for Wednesday in the UK. On the other hand, the US will release its inflation report, which traders are hoping for. Volatility has been falling in recent days, but may rise today.
Explanations for the chart:
Support and Resistance Levels are the levels that serve as targets when buying or selling the pair. You can place Take Profit near these levels.
Kijun-sen and Senkou Span B lines are lines of the Ichimoku indicator transferred to the hourly timeframe from the 4-hour one.
Support and resistance areas are areas from which the price has repeatedly rebounded off.
Yellow lines are trend lines, trend channels and any other technical patterns.
Indicator 1 on the COT charts is the size of the net position of each category of traders.
Indicator 2 on the COT charts is the size of the net position for the non-commercial group.


