


Trend analysis (Fig. 1).
On Tuesday, the price will attempt to fall from 1.0298 (closing of yesterday's daily candlestick) and test the 23.6% retracement level of 1.0270 (blue dotted line). When this line is reached, quotes could rise to the 61.8% retracement level of 1.0359 (blue dotted line). The pair may then rise to 1.0422 resistance (blue bold line).
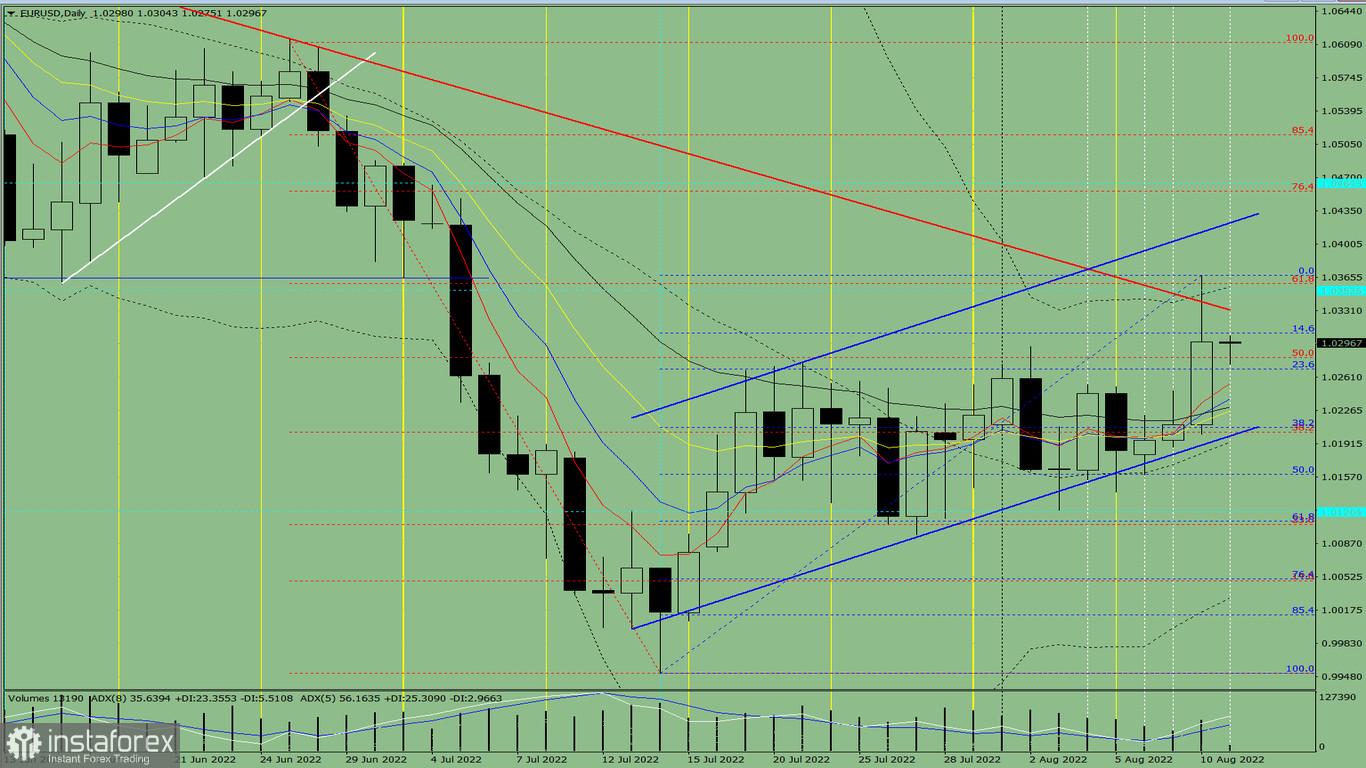
Fig. 1 (daily chart).
Complex analysis:
- indicator analysis - up
- Fibonacci levels - up
- volumes - up
- candlestick analysis - up
- trend analysis - up
- Bollinger bands - down
- weekly chart up
Conclusion:
On Tuesday, the price will attempt to fall from 1.0298 (closing of yesterday's daily candlestick) and test the 23.6% retracement level of 1.0270 (blue dotted line). When this line is reached, the quote could rise to the 61.8% retracement level of 1.0359 (blue dotted line). The pair may then rise to 1.0422 resistance (blue bold line).
Alternative scenario: the price will attempt to fall from 1.0298 (closing of yesterday's daily candlestick) and test the EMA 21 at 1.0229 (black thin line). When this line is approached, the quote could grow to the 61.8% retracement level of 1.0359 (blue dotted line). The pair may then increase to 1.0422 resistance (blue bold line).


