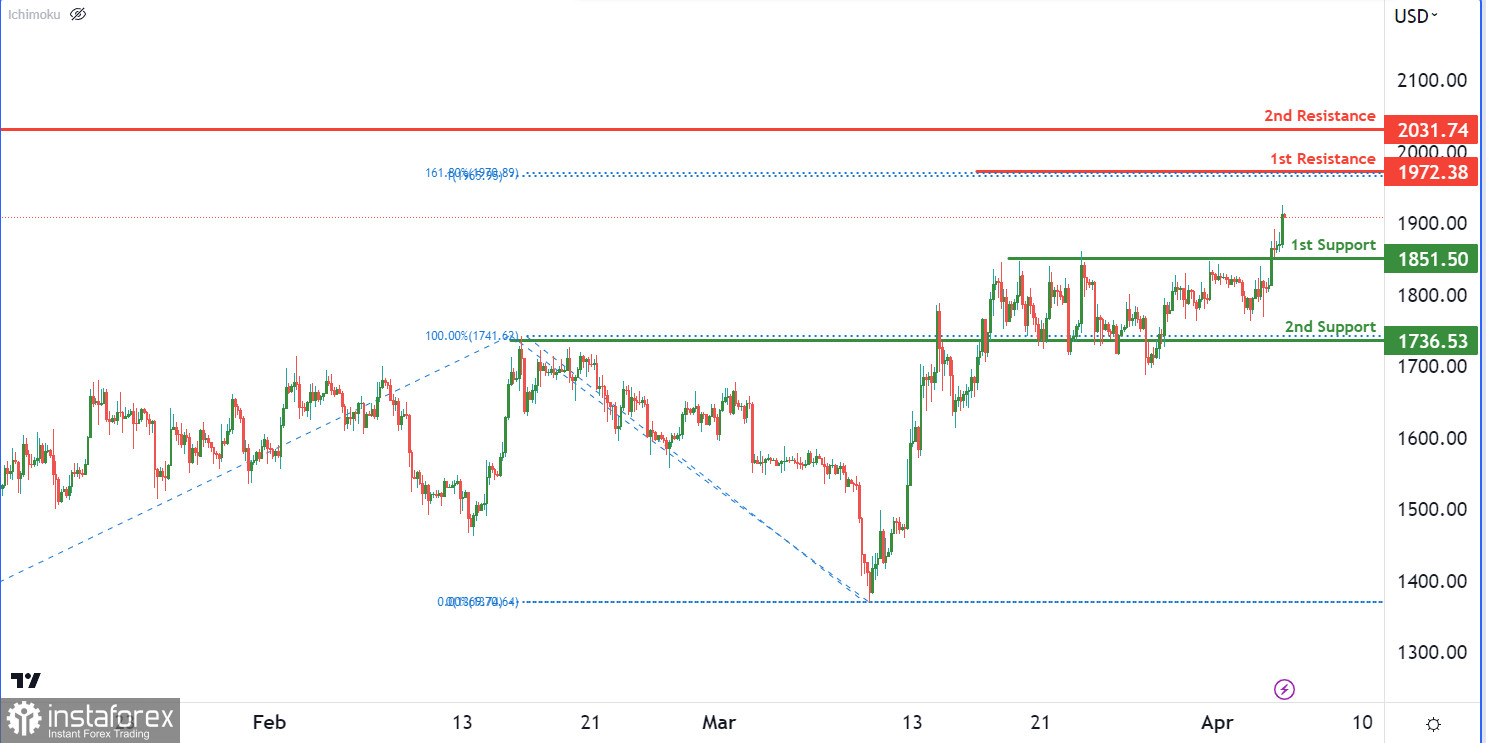
ETH/USD chart exhibits strong bullish momentum and has the potential to continue towards the 1st resistance level.
The 1st support level at 1851.50 is a pullback support, which adds significance to its potential as a strong support level. Additionally, the 2nd support level at 1736.53 is an overlap support, further confirming its potential as a support level.
However, the 1st resistance level at 1972.38 is a swing high resistance, and moving higher, the 2nd resistance level at 2031.74 is also a swing high resistance. These levels suggest potential selling pressure that could limit price appreciation.


