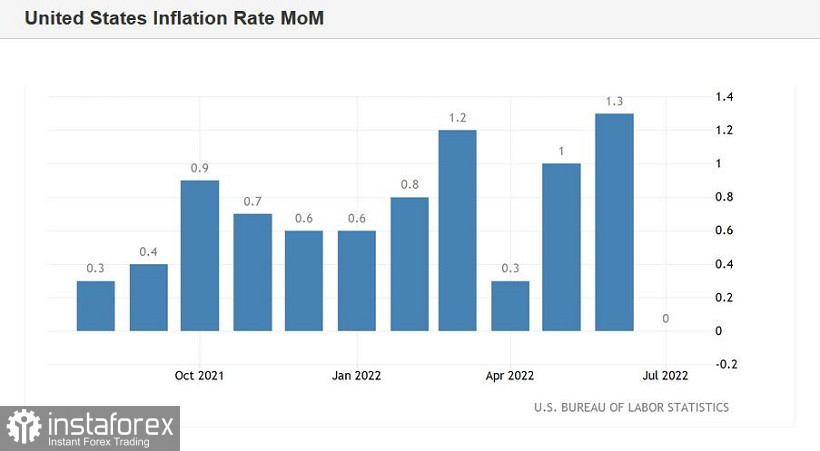
Bulls on the EUR/USD pair could not hold their positions after the release of disappointing data on the growth of US inflation. Having reached the local price peak at 1.0370 (a monthly high), the bulls had to give in to the onslaught of the bears. They made another attempt to approach the boundaries of the 4th figure on Thursday, but also failed and gave the initiative to the bears, who returned the price to the area of the 2nd figure.

However, it is too early to draw final conclusions. After all, the fact remains that the dollar this week lost an important trump card of a fundamental nature, which supported the greenback for a long time. For several months, it was kept afloat due to two factors: geopolitical instability (increasing anti-risk sentiment) and hawkish Federal Reserve sentiment (increasing hawkish expectations). To date, the dollar bulls are no longer feeling so confident: the latest inflationary releases made market participants think - is the Fed ready to further tighten monetary policy at an aggressive pace amid a slowdown in inflationary growth? This key issue will haunt the US currency for more than one week. Therefore, talking about the "dollar's return", focusing only on the Friday price rollback of EUR/USD, is at least premature.
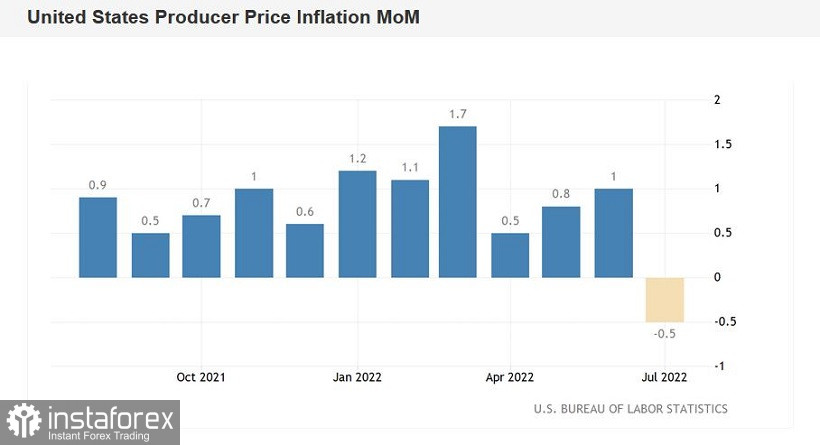
Let me remind you that this week three (!) inflation reports came out in the red zone at once, significantly falling short of the forecast values. The consumer price index, the producer price index and the import price index - all these inflationary indicators have slowed down their growth, and much stronger than the preliminary forecasts. In particular, the Producer Price Index on a monthly basis fell into negative territory in July, reaching -0.5%. This is the weakest result since May 2020. The Import Price Index released today also showed negative dynamics: for the first time since December 2021, it fell below zero, reaching -1.4% (the weakest result since April 2020). Inflationary releases overshadowed the strong Nonfarm, which was published exactly a week ago.
As a result, the market lost faith that the US Federal Reserve at the September meeting will raise the interest rate by 75 points. The probability of realization of this scenario has significantly decreased, and this fact had a background pressure on the US currency.
At the same time, the market is firmly convinced that the Fed will continue to tighten monetary policy at a "sporty pace". The base scenario, most common among experts, assumes a 50-point rate hike in September and November and a 25-point rate hike in December. This scenario looks the most realistic, and given the first signs of a slowdown in US inflation, we can assume that this scenario can only be revised in the dovish direction (for example, a 50-point rate hike at the September meeting and two 25-point increases to end of the current year). The vast majority of analysts have no doubt that the Fed will maintain a hawkish course, the only question is the pace of monetary tightening. After all, the de facto cost of living in the United States remains "painfully high", as evidenced, in particular, by the steady rise in food and housing prices.
The structure of the July growth of the CPI suggests that its decline was due to a slowdown in the growth of energy prices. Thus, the growth rate of energy prices in July slowed down to 32% after the highest growth in June, when a 42-year high of 41.6% was recorded. In particular, gasoline rose in price "only" by 44%in July (the increase was at the level of 60% in June, this is the peak since March 1980), natural gas prices rose by 30% after rising by almost 40% in June (this is the highest value since autumn 2005).
Thus, on the one hand, we see "tendentious" inflationary releases that hint that US inflation may have reached its peak in June. On the other hand, inflation indicators remain at an "obscenely high" level, forcing members of the Fed to further tighten monetary policy.


Summarizing all of the above, we can come to some conclusions.
Firstly, published inflation reports are unlikely to lead to a reversal of the downward trend. Even if the Fed implements the base scenario of tightening monetary policy, it will still remain at the forefront of this process, and even more so compared to the European Central Bank.
However, the dollar has become more vulnerable given the fact that it can no longer count on the Fed's ultra-hawkish sentiment. In the context of the EUR/USD pair, this means that the bears are unlikely to lower the price to the parity level in the medium term (not to mention breaking the 1.0000 mark). Bulls of the pair, in turn, will be able to expand the visible price territory - if over the past almost three weeks the pair did not rise above 1.0280, now their "ceiling" is 1.0410 (the upper limit of the Kumo cloud on the daily chart).
Thirdly, the fact that inflationary growth is slowing down will bring back another discussion to the information space - about possible actions by the Fed next year. Let me remind you that at the end of July, there were several proposals on the market that the central bank would begin to gradually reduce the interest rate in the second half of 2023. In July, some representatives of the central bank denied such intentions, saying that the Fed had not yet coped with "task number 1", that is, it had not yet curbed the jump in inflation. But now that the first signs of a slowdown in the CPI have appeared, dove rumors will again flood the information space, putting background pressure on the greenback.
Thus, in my opinion, the EUR/USD pair has not exhausted the potential for corrective growth and has not fully won back the disappointing inflation reports. Under such conditions, it is very risky to open short positions on the pair, especially considering the "Friday factor". But next week, the focus will be on the support level of 1.0220 (the middle line of the Bollinger Bands indicator on the daily chart). If the bears fail to overcome this target, bulls are likely to seize the initiative. In this case, we can consider long positions to 1.0310 (the upper line of the Bollinger Bands on D1) and 1.0350 (the lower boundary of the Kumo cloud on the same timeframe).


