


Analysis of Monday's deals:
30M chart of the EUR/USD pair
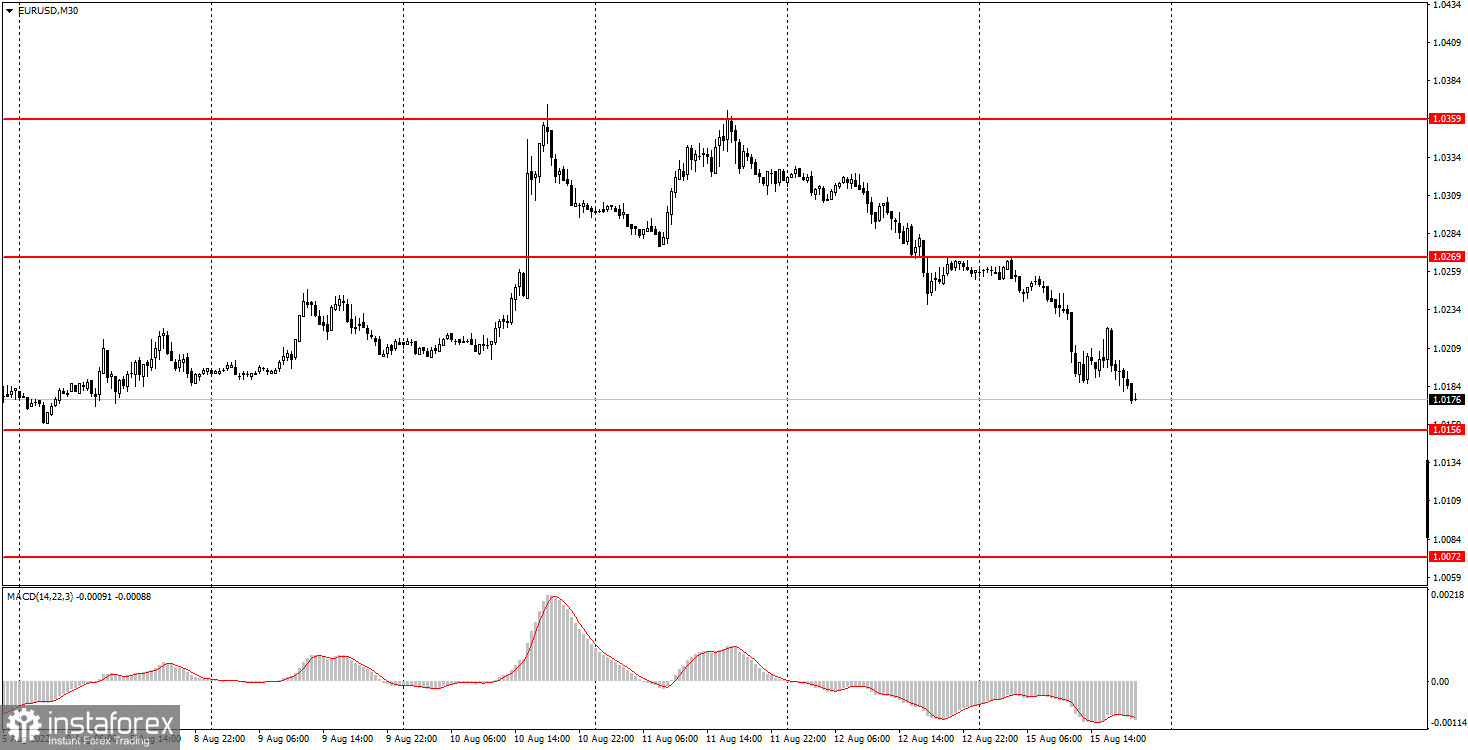
The EUR/USD currency pair continued to trade quite actively on Monday, despite the empty calendar of macroeconomic events. The pair passed 100 points during the day, which is a lot for Monday. However, today shows traders that the market is not ready to buy the euro. After it rose sharply last week against the backdrop of US inflation, the bulls' fuse dried up very quickly, and the pair cheerfully rushed down. Thus, we believe that the global downward trend will be resumed, and the euro will drop again and renew its 20-year lows. It is noteworthy that last week, many traders thought that the downward trend was over. Recall that the euro rose in price both on the increase in the Federal Reserve rate by 0.75%, and on the fall of US inflation, that is, in any case, the euro rose in price, and the dollar fell. And at the same time, over the past month, the euro managed to add only 400 points, which is very, very little globally. From our point of view, this moment also shows that the downward trend is not over and will resume. This week there will be several important reports at once, in particular in the European Union. So for sure, novice players expect stormy days.
5M chart of the EUR/USD pair
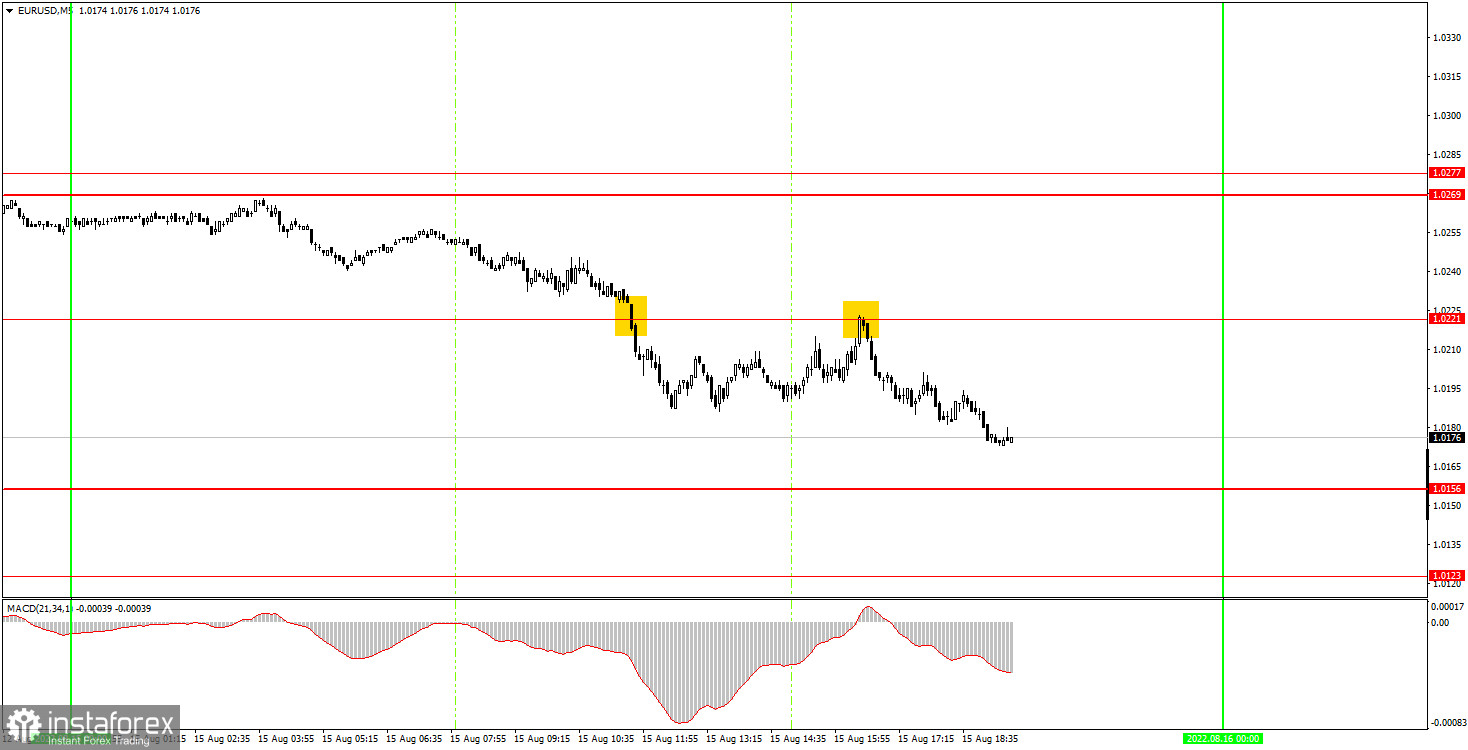
On the 5-minute timeframe, the movement on Monday was, if not ideal, then close to it. Unfortunately, again it was not possible to catch the very beginning of this movement, but today the situation was still better than last week. The first sell signal was formed when the price settled below the level of 1.0221. After that, it managed to go down more than 20 points, which was enough to set Stop Loss to breakeven. However, the pair failed to reach the nearest target level, and it returned to the level of 1.0221. Therefore, the first short position closed at zero. However, there immediately followed a rebound from the level of 1.0221 and a new sell signal, which also had to be worked out. This time the pair moved down more confidently, but by the evening it still failed to reach 1.0156. Thus, the short position had to be closed manually at a profit of about 30 points. Not much, but better than nothing.
How to trade on Tuesday:
On the 30-minute timeframe, the pair shows with all its appearance that it is ready to resume the downward trend. So far, there is no trend line or channel, since there are not at least two reference points by which they could be formed. Nevertheless, the pair has been falling for two consecutive days, despite the fact that there were no macroeconomic reasons for this. It looks like the market is starting to look in the direction of buying the US dollar again. On the 5-minute TF on Tuesday, it is recommended to trade at the levels of 1.0072, 1.0123, 1.0156, 1.0221, 1.0269-1.0277, 1.0354. When passing 15 points in the right direction, you should set Stop Loss to breakeven. No major events or reports are scheduled for Tuesday in the US or the EU. A report on industrial production will be released in America, but the reaction to it may be a movement of 20-30 points, no more.
Basic rules of the trading system:
1) The signal strength is calculated by the time it took to form the signal (bounce or overcome the level). The less time it took, the stronger the signal.
2) If two or more deals were opened near a certain level based on false signals (which did not trigger Take Profit or the nearest target level), then all subsequent signals from this level should be ignored.
3) In a flat, any pair can form a lot of false signals or not form them at all. But in any case, at the first signs of a flat, it is better to stop trading.
4) Trade deals are opened in the time period between the beginning of the European session and until the middle of the US one, when all deals must be closed manually.
5) On the 30-minute TF, using signals from the MACD indicator, you can trade only if there is good volatility and a trend, which is confirmed by a trend line or a trend channel.
6) If two levels are located too close to each other (from 5 to 15 points), then they should be considered as an area of support or resistance.
On the chart:
Support and Resistance Levels are the Levels that serve as targets when buying or selling the pair. You can place Take Profit near these levels.
Red lines are the channels or trend lines that display the current trend and show in which direction it is better to trade now.
The MACD indicator (14,22,3) consists of a histogram and a signal line. When they cross, this is a signal to enter the market. It is recommended to use this indicator in combination with trend lines (channels and trend lines).
Important speeches and reports (always contained in the news calendar) can greatly influence the movement of a currency pair. Therefore, during their exit, it is recommended to trade as carefully as possible or exit the market in order to avoid a sharp price reversal against the previous movement.
Beginners on Forex should remember that not every single trade has to be profitable. The development of a clear strategy and money management are the key to success in trading over a long period of time.


