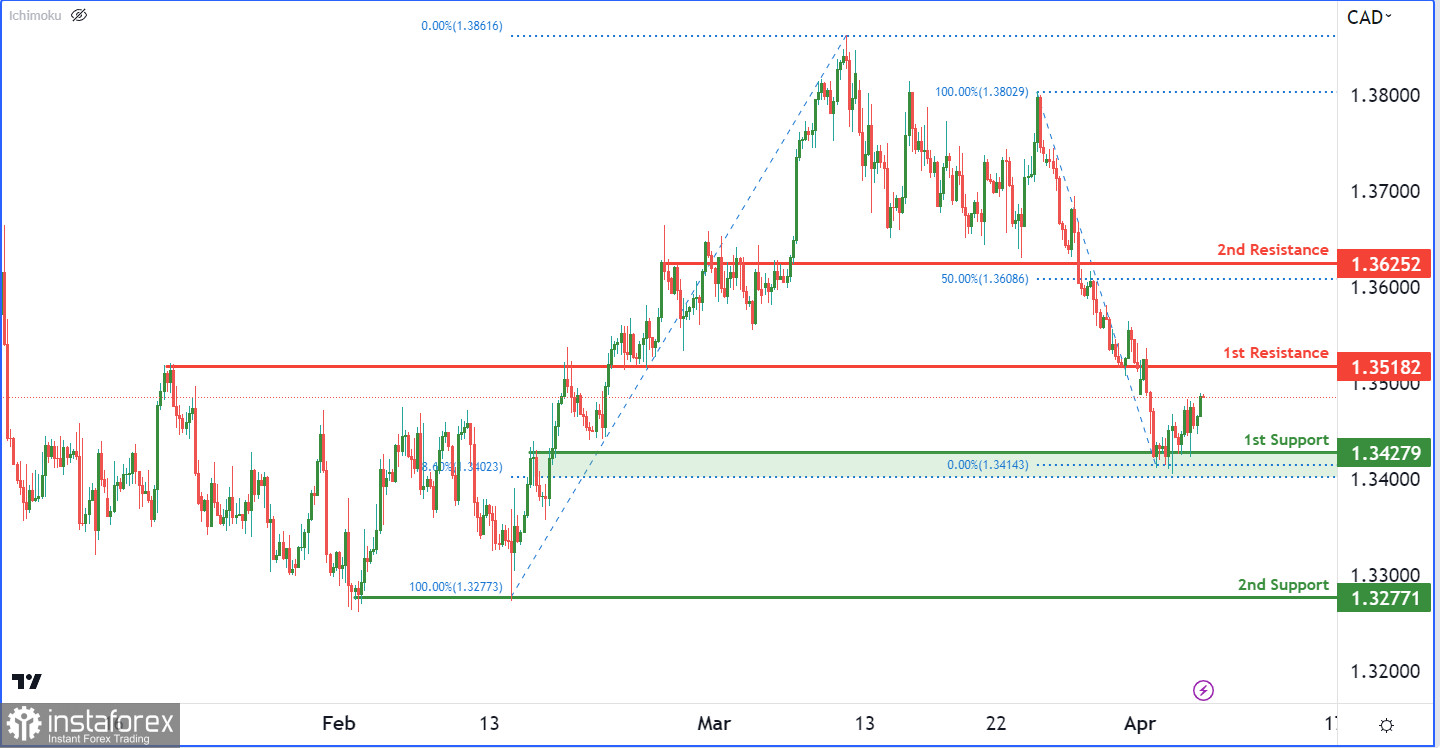
The USD/CAD chart is currently displaying bullish momentum, suggesting a potential rise in the price of the pair in the near future, although there are no clear contributing factors to this momentum.
There is a possibility of a bullish continuation towards the 1st resistance level at 1.3518, which coincides with a pullback resistance level. If the price breaks through this level, it could potentially rise towards the 2nd resistance level at 1.3625, which also coincides with a pullback resistance level and a 50% Fibonacci retracement.
Alternatively, in the event of a price drop, the 1st support level at 1.3427, which is an overlap support level with a 78.60% Fibonacci retracement lining up with it, may provide some level of support. If the price were to break through this level, it could potentially drop towards the 2nd support level at 1.3277, which has acted as a multi-swing low support level in the past.