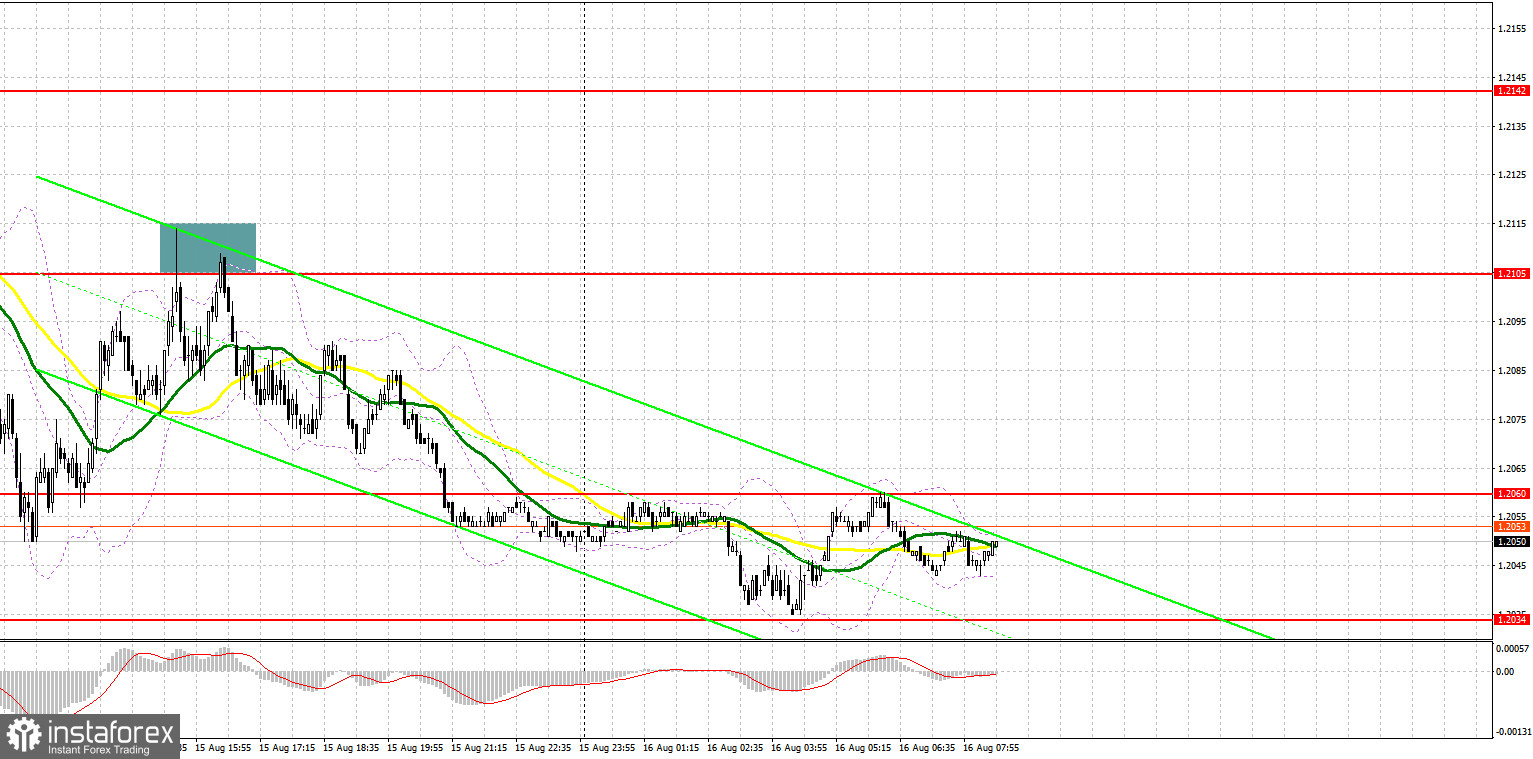
For long positions on GBP/USD:Yesterday, we had several signals to enter the market. Let's have a look at the 5-minute chart and see what happened there. In the second half of the day, a correction at the 1.2105 level resulted in a false breakout and two good signals to sell the pound. Consequently, the pound plunged to 1.2060 which allowed traders to gain 40 pips in profit.

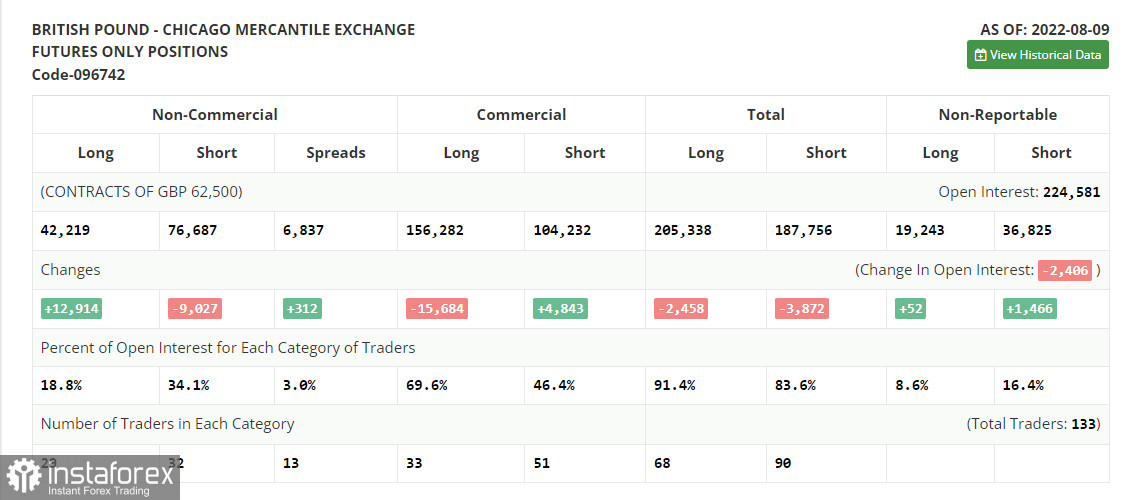
Before analyzing technical aspects, let's first discuss the futures market. The COT (Commitment of Traders) report for August 9 recorded a decline in short positions and an increase in the long ones which led to a reduction in the negative delta. Despite the fact that UK's GDP for the second quarter suggests that the UK economy may recover faster, there is still huge pressure on local households due to soaring prices which makes the cost of living crisis even worse. Besides, fears that the UK may enter a recession by the end of the year dampen investor optimism. In addition to this, GBP/USD is highly affected by the policy of the US Federal Reserve. Last week, the data showed that inflation in the US has slowed down a bit. On the one hand, this can be a good moment to buy risk assets. Yet, this factor is unlikely to intensify the bullish sentiment on the pound. The pair will most likely stay in a wide sideways channel until the end of the month. Therefore, new highs are still far ahead. According to the COT report, long positions of the non-commercial group of traders rose by 12,914 to 42,219, while short positions declined by 9,027 to 76,687. This resulted in the negative non-commercial net position being reduced to -34,468 from -56,409. The weekly closing price dropped to 1.2038 from 1.2180.

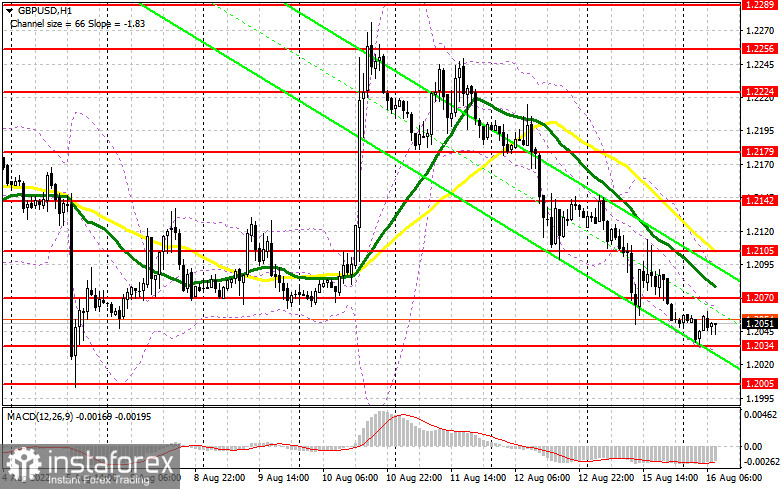
Today we expect the employment data from the UK. The most important indicator will be the change in the average income. A decline will mean a further burden on UK households that will have to tackle 13.0% inflation and record-high energy prices as soon as this autumn. Even If the employment data comes in more or less encouraging, the market is still unlikely to show any serious reaction. However, a slight recovery is possible after a 3-day fall. If GBP/USD depreciates in the first half of the day, the best moment to buy the pair will be a false breakout of the nearest support at 1.2034 which has already been tested this morning. The pair has the chance to jump to the upside to the 1.2070 level, above which moving averages are located. They are currently supporting the bears. Only a strong hold above 1.2070 will indicate the formation of a possible upside correction on the pair. A breakout of 1.2070 and its downward retest will pave the way towards the high of 1.2105 from where the pound has already plunged this week. The level of 1.2142 will serve as a more distant target. At this point, I would recommend taking profit. In case GBP/USD falls and there are no buyers at 1.2034, the pound will come under more pressure, and bulls will be forced to leave the market. If so, it is better to buy the pound only when the price reaches the key support of 1.2005 that was formed this month. Long positions should be opened only on a false breakout. Going long on GBP/USD right after a rebound will be possible from the level of 1.1964, or even lower from 1.1929. Bear in mind a possible correction of 30-35 pips within the day.
For short positions on GBP/USD:
The main task for bears today is to protect the resistance level of 1.2070 where the moving averages supporting the bearish trend are currently located. If they fail to do so, the short-term bearish trend formed at the end of last week will be cancelled. A false breakout of 1.2070 will bring back the pressure on the pound and create a sell signal with the target at the nearest support of 1.2034. Downbeat unemployment data for June in the UK and negative changes in average income will push the pair lower. A breakout of 1.2034 and its upward retest will create a good entry point for selling the pound with the downward target at 1.2005. A more distant target is found in the area of 1.1964 where I recommend profit taking. If GBP/USD rises and there are no sellers at 1.2070, bulls will get a great opportunity to return the price to 1.2105, which will discourage the bears. Only a false breakout at 1.2105 will create an entry point for opening short positions, considering a new decline of the pair. If nothing happens there as well, the price may surge to the upside to the high of 1.2142. This is where I recommend selling GBP/USD right after a rebound, bearing in mind a possible intraday correction of 30-35 pips.

Indicator signals:
Moving Averages
Trading below the 30 and 50-day moving averages indicates that bears can still push the pair lower.
Please note that the time period and levels of the moving averages are analyzed only for the H1 chart, which differs from the general definition of the classic daily moving averages on the D1 chart.
Bollinger Bands
A breakout of the lower band at 1.2030 will intensify the bearish pressure on the pair. In case the pair advances, the upper band at 1.2095 will serve as resistance.
Description of indicators:
• A moving average of a 50-day period determines the current trend by smoothing volatility and noise; marked in yellow on the chart;
• A moving average of a 30-day period determines the current trend by smoothing volatility and noise; marked in green on the chart;
• MACD Indicator (Moving Average Convergence/Divergence) Fast EMA with a 12-day period; Slow EMA with a 26-day period. SMA with a 9-day period;
• Bollinger Bands: 20-day period;
• Non-commercial traders are speculators such as individual traders, hedge funds, and large institutions who use the futures market for speculative purposes and meet certain requirements;
• Long non-commercial positions represent the total number of long positions opened by non-commercial traders;
• Short non-commercial positions represent the total number of short positions opened by non-commercial traders;
• The total non-commercial net position is the difference between short and long positions of non-commercial traders.


