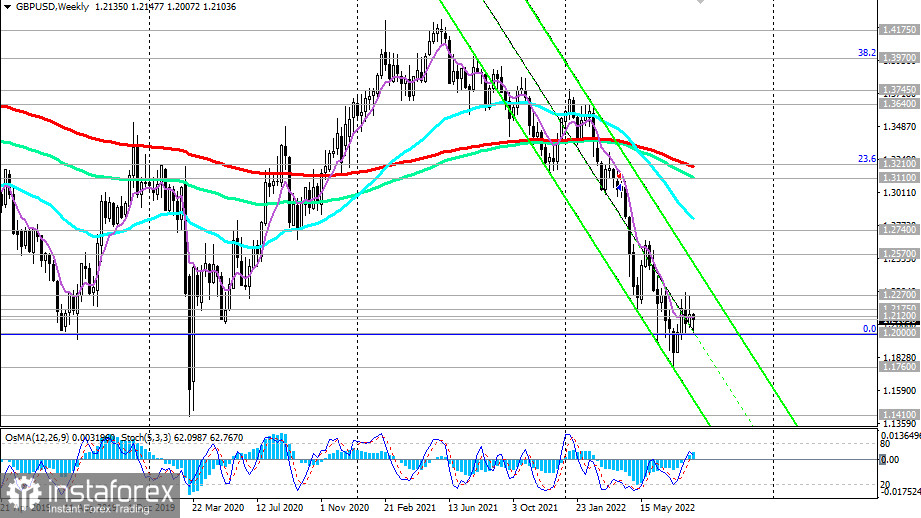
Since June last year, GBP/USD has been developing a downward trend, reaching a local 28-month low near 1.1760 at the beginning of last month.
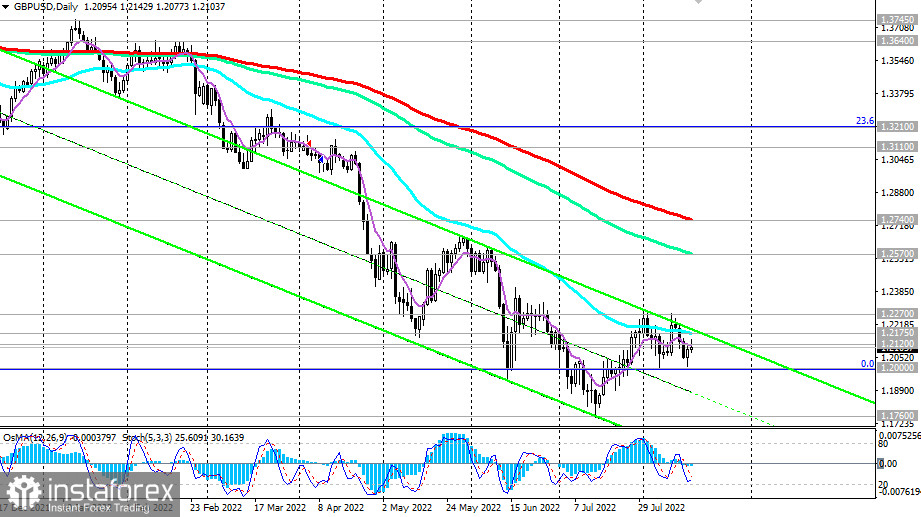
After that, the pair tried to develop an upward correction. However, its growth was limited by the local resistance level of 1.2270.
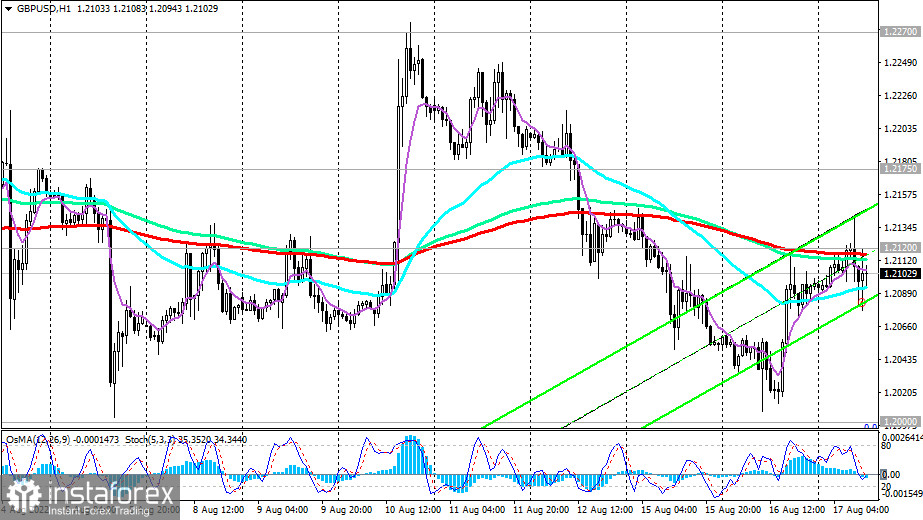
After that, having broken through the important support level 1.2175 (50 EMA on the daily chart), GBP/USD returned inside the descending channel on the daily chart and to the current level of 1.2100.

The breakdown of the "round" support level of 1.2000 is "not far off."
Below the key resistance levels 1.2570 (144 EMA on the daily chart), 1.2740 (200 EMA on the daily chart), GBP/USD remains in the zone of the long-term bearish market.
After the breakdown of the support level of 1.2000, the next target will be the local support level of 1.1760, and then the mark of 1.1410 (March 2020 low and the lower limit of the descending channel on the weekly chart).

In an alternative scenario, and after the breakdown of the resistance levels of 1.2175, 1.2270 (local high), GBP/USD will head towards the resistance levels of 1.2570, 1.2600. The breakdown of the resistance level of 1.2740 will be the first serious signal that the pair will return to the long-term bull market zone.
In the meantime, short positions remain preferable.
Support levels: 1.2000, 1.1900, 1.1800, 1.1760, 1.1410
Resistance levels: 1.2120, 1.2175, 1.2270, 1.2570, 1.2740, 1.2800
Trading Tips
Sell Stop 1.2070. Stop-Loss 1.2150. Take-Profit 1.2000, 1.1900, 1.1800, 1.1760, 1.1410
Buy Stop 1.2150. Stop-Loss 1.2070. Take-Profit 1.2175, 1.2270, 1.2570, 1.2740, 1.2800


