


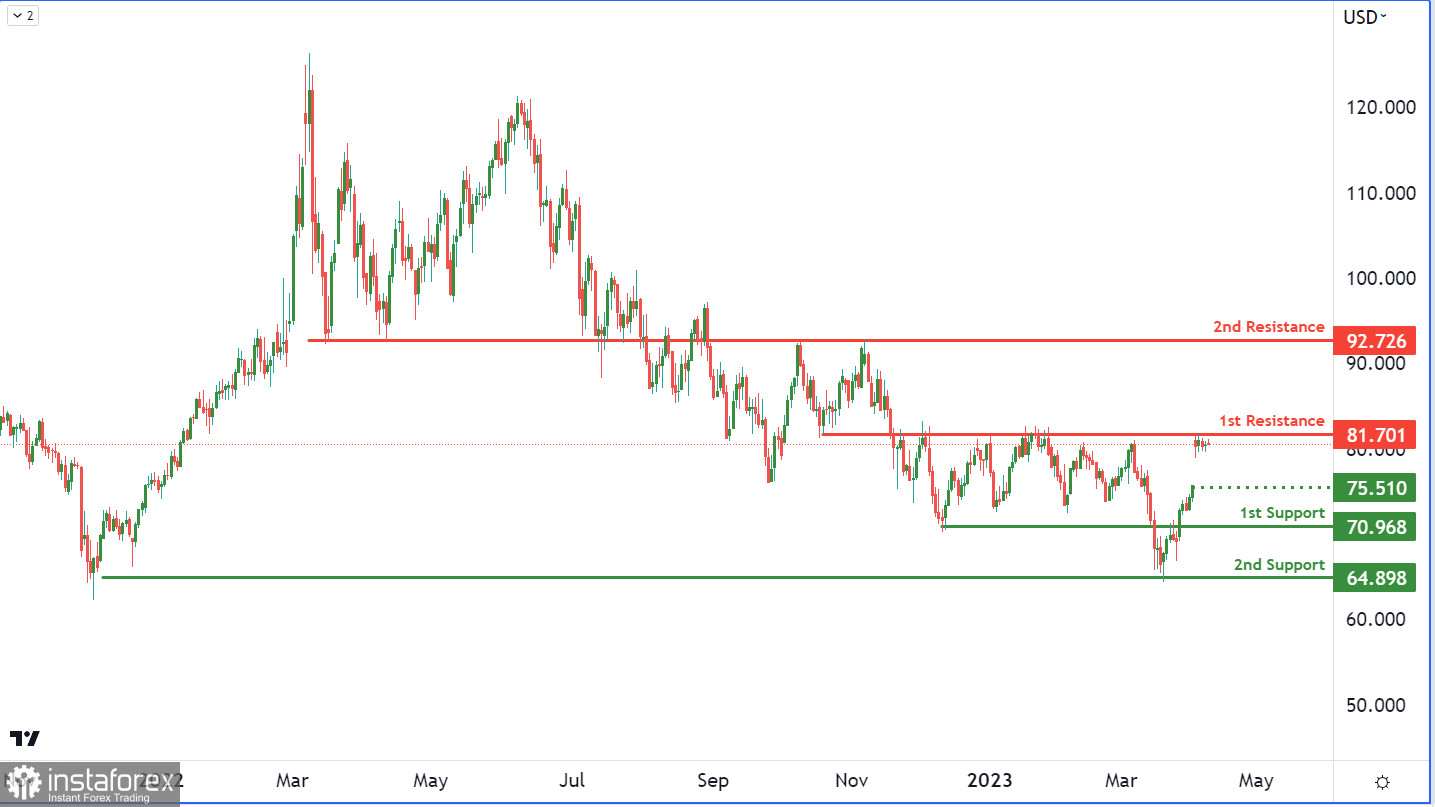
The WTI crude oil chart is currently exhibiting bearish momentum, with a potential for a drop towards the 1st support level. The chart's overall bias is bearish, as price is trading below the Ichimoku cloud and there is a long-term descending trend line indicating further bearish momentum.
As for the support and resistance levels, the 1st support level at 70.96 is a strong overlap support level, while the 2nd support level at 64.89 is a multi-swing low support level. If the price were to rise, the 1st resistance level at 81.70 is a pullback resistance level, with the 2nd resistance level at 92.72 being another pullback resistance level. Additionally, there is an intermediate support level at 75.51, which is a swing low support level.


