


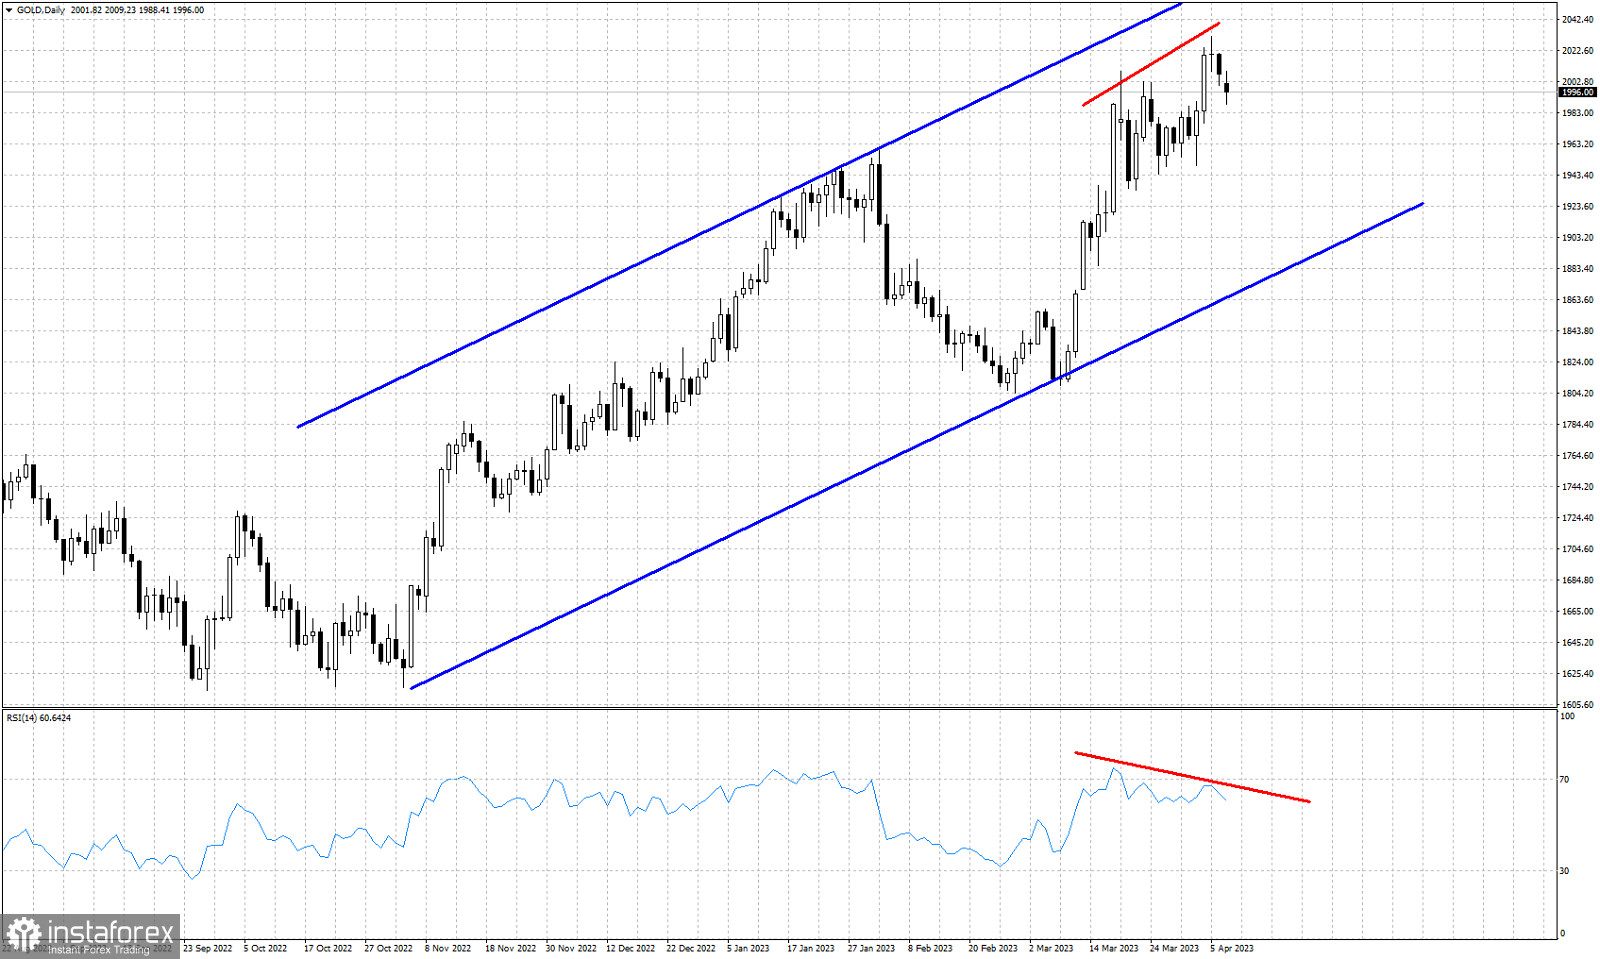
Blue lines- bullish channel
Red lines- bearish RSI divergence
Gold price is trading around $2,000-$1,990. Price is under pressure for the last couple of sessions after making a high around $2,031. Three sessions ago Gold candlestick pattern formed a long-legged doji pattern which is usually found at turning points. Combined with the fact that the RSI is making lower highs providing a bearish divergence, we could see a deeper pull back in Gold price. Key support is found at $1,860-75 at the lower channel boundary. A pull back towards the lower channel boundary is justified and that is why we repeat what we said in our previous analysis, bulls need to be cautious as a reversal could come any time soon.


