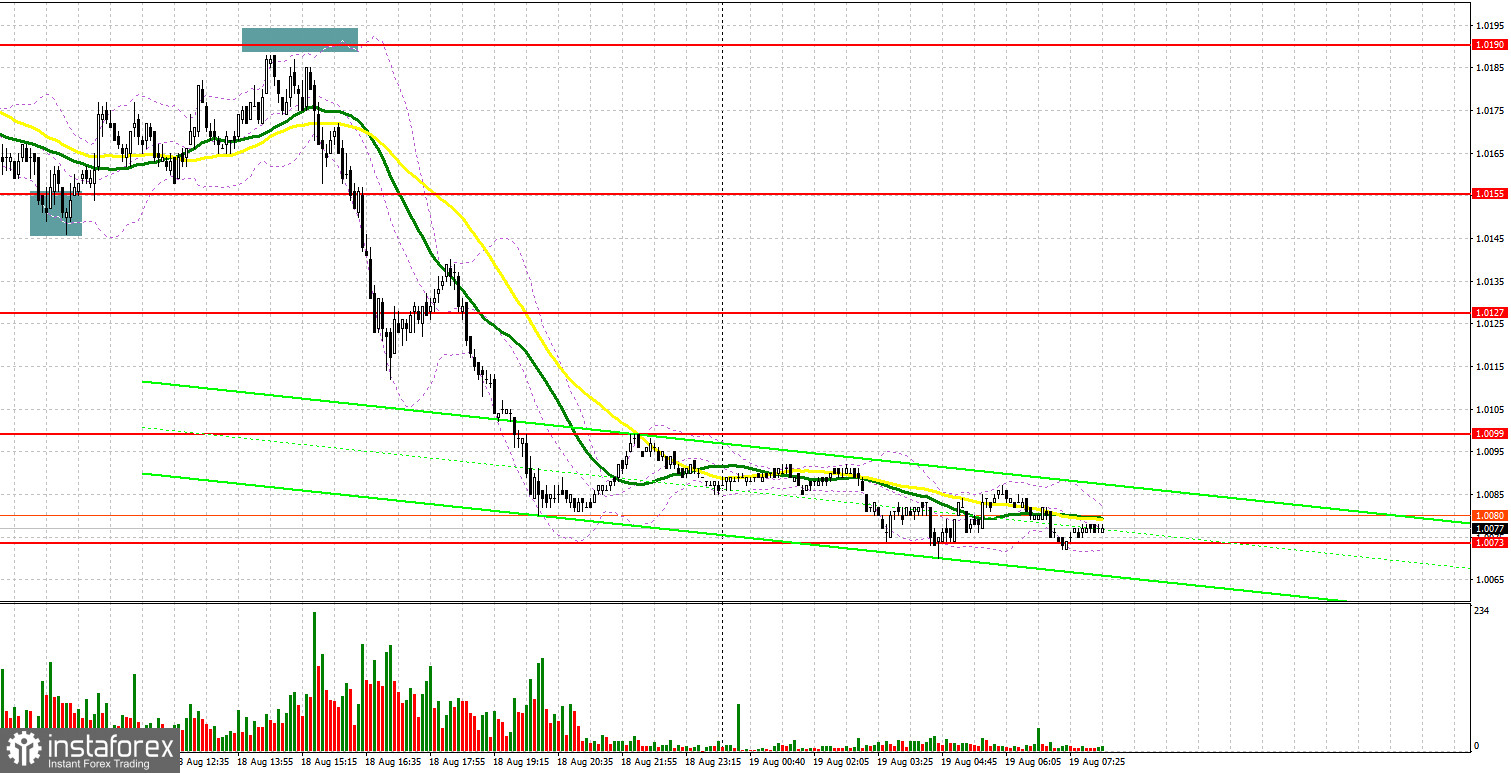
Yesterday, not as many signals were formed as we would like. Let's take a look at the 5-minute chart and see what happened. I paid attention to the 1.0155 level in my morning forecast and advised that you make decisions on entering the market from it. The pair's decline in the area of 1.0155 in the first half of the day and a false breakout at this level resulted in creating a buy signal. As a result, the pair rose by 30 points, but data on further inflation growth in the euro area stopped the bull market. In the second half of the day, just a little bit was enough to form a false breakout formed in the area of 1.0190, so it was not possible to get a good entry point for selling there. I did not wait for other signals to enter the market.

When to go long on EUR/USD:
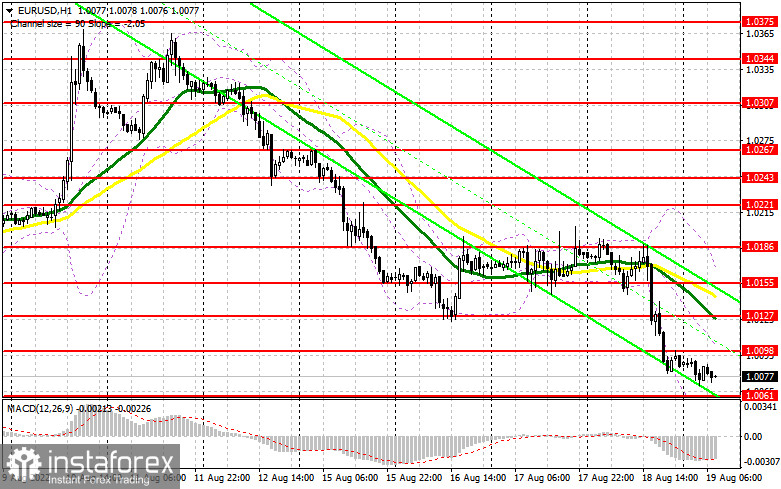
Obviously, the pressure on risky assets is growing as the likelihood of a recession in the economies of developed countries increases, and a second update of the parity of the euro against the dollar is more than real. Many are wondering whether there will be a breakdown of the level of 1.0000, or we will see a double bottom and a signal for a medium-term market reversal in favor of strengthening risky assets - but I would not particularly count on the second scenario. Only data on producer prices in Germany will be released this morning, which is unlikely to support the euro and be able to save the pair from the bear market. Therefore, with long positions in the current conditions, I advise you not to rush - I recommend putting on short positions further along the medium-term trend and updating the parity. In case the pair falls further, forming a false breakout in the area of 1.0061 will give a signal to open long positions in hopes that the pair will continue to recover with the prospect of updating the nearest resistance at 1.0098, formed on the basis of yesterday. A breakthrough and test from top to bottom of this range will hit the bears' stop orders, creating another signal to enter longs with the possibility of updating 1.0127, while the resistance at 1.0155 will be a more distant target, where I recommend taking profits.
If the EUR/USD falls and there are no bulls at 1.0061, which is more likely in the first half of the day, the pressure on the pair will increase. The best option for opening longs in this case would be a false breakout in the area of 1.0037. I advise you to buy EUR/USD immediately on a rebound only from 1.0008, or even lower - around the parity of 0.9958, counting on an upward correction of 30-35 points within the day.
When to go short on EUR/USD:
The bears' main task is to protect the major resistance at 1.0098. The optimal scenario for opening short positions would be a false breakout at this level after the data on inflation in Germany is released, which will lead the euro to move down to 1.0061. Breakdown and consolidation below this range will not be long in coming, as it will be useless to resist in this case. A reverse test from the bottom up creates another sell signal with the removal of bulls' stop orders and a larger movement of the pair to the 1.0037 area, and there it is within easy reach to the parity of the euro against the US dollar, where I recommend taking profits. A more distant target will be the area of 0.9958.
If EUR/USD moves up during the European session, as well as the absence of bears at 1.0098, and the option of profit taking on short positions also cannot be ruled out at the end of the week, the situation may change slightly in favor of the bulls. In this case, I advise you to postpone short positions until 1.0127, but only if a false breakout is formed there. You can sell EUR/USD immediately for a rebound from the high of 1.0155, or even higher - from 1.0186, counting on a downward correction of 30-35 points.

COT report:
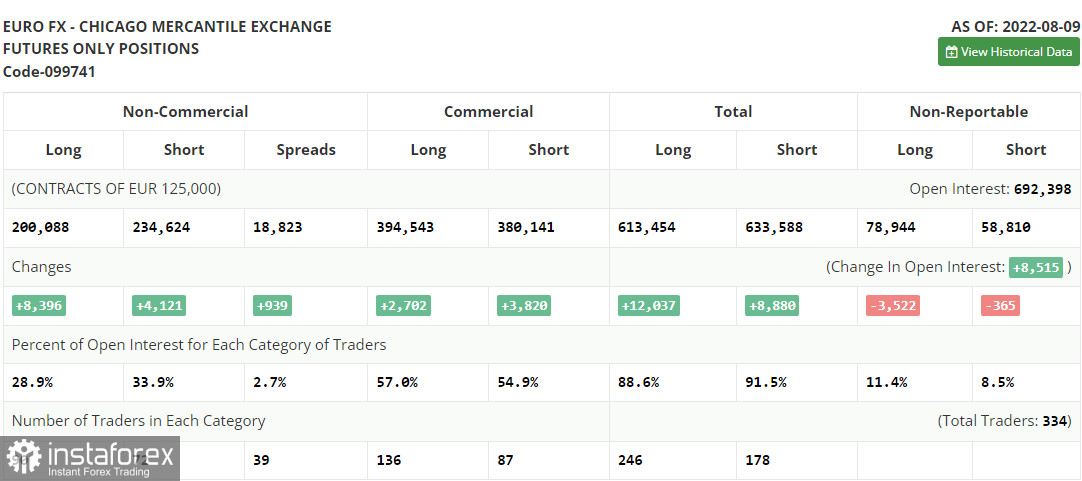
The Commitment of Traders (COT) report for August 9 logged a sharp increase in both short and long positions, but the former turned out to be more, which continues to indicate the gradual end of the bear market and an attempt to find a market bottom after reaching euro parity against the US dollar. Statistics on inflation in the US came out last week, which turned everything upside down. The first slowdown in inflationary pressure in recent times since reaching a peak of 10.0% has brought back demand for risky assets. But, as you can see on the chart, it didn't last long. The risk of deterioration of the situation associated with the recession of the global economy discourages traders and investors from any desire to build up long positions in the euro. There are no important reports this week that can help the euro regain lost ground, so I would recommend betting more on trading on the horizontal channel. Definitely, before the fall of this year, we can hardly expect serious market shocks. The COT report shows that long non-commercial positions rose by 8,396 to 200,088, while short non-commercial positions jumped by 4,121 to 234,624. At the end of the week, the overall non-commercial net position remained negative, but slightly increased from -39,811 to -34,536, which indicates a continuation of the market turning towards euro bulls. The weekly closing price increased and amounted to 1.0233 against 1.0206.

Indicator signals:
Moving averages
Trading is below the 30 and 50-day moving averages, indicating a continuation of the bear market.
Note: The period and prices of moving averages are considered by the author on the H1 hourly chart and differs from the general definition of the classic daily moving averages on the daily D1 chart.
Bollinger Bands
In case of a decline, the lower border of the indicator around 1.0037 will act as support. In case of growth, the upper border of the indicator in the area of 1.0155 will act as resistance.
Description of indicators
- Moving average (moving average, determines the current trend by smoothing out volatility and noise). Period 50. It is marked in yellow on the chart.
- Moving average (moving average, determines the current trend by smoothing out volatility and noise). Period 30. It is marked in green on the chart.
- MACD indicator (Moving Average Convergence/Divergence — convergence/divergence of moving averages) Quick EMA period 12. Slow EMA period to 26. SMA period 9
- Bollinger Bands (Bollinger Bands). Period 20
- Non-commercial speculative traders, such as individual traders, hedge funds, and large institutions that use the futures market for speculative purposes and meet certain requirements.
- Long non-commercial positions represent the total long open position of non-commercial traders.
- Short non-commercial positions represent the total short open position of non-commercial traders.
- Total non-commercial net position is the difference between short and long positions of non-commercial traders.


