


Long-term perspective.
The EUR/USD currency pair has lost about 220 points during the current week. Thus, we can conclude that the global downtrend has resumed. Look at the 24-hour TF – there you can see what we have been talking about repeatedly in recent weeks. The pair once again corrected by 400 points within the downtrend and again could not exceed the Ichimoku cloud. Therefore, the answer to the question "what is the current trend in the market?" is obvious. The euro currency has completed the "minimum task" and is now ready to conquer new lowlands. Consequently, in the next week or two, we will see an update of the 20-year lows, and the pair will again go below price parity with the dollar. If you try to find specific reasons why the euro fell again this week, then most likely nothing will work. There were neither important fundamental events, nor important geopolitical ones, nor, moreover, macroeconomic ones. On the contrary, the GDP report in the European Union turned out to be very good, and there was no important data in the US that could provoke the strengthening of the US currency. Of course, we can recall that Europe is on the verge of recession. If I may say so, "gas recession." The price of "blue fuel" is growing at a cruising pace and, even if the "gas war" between the Russian Federation and the EU does not happen, prices are now such that many factories and companies will not be able to buy it in the winter in the same volume. This means that production will decrease, and with it, GDP will decrease, and even an ECB rate hike will not be needed to prevent a recession. Thus, it is quite possible to assume that new fears related to the recession in the EU have negatively affected the euro exchange rate. However, we would like to remind you that, technically, the recession has already begun in the USA, so both countries are in approximately the same situation. Accordingly, we believe that the "gas issue" has absolutely nothing to do with it. The problem is complex and lies in the same thing as before - the geopolitics that is difficult for the European Union and the divergence between the monetary approaches of the Fed and the ECB is too strong.
COT analysis.
The COT reports on the euro currency in the last few months reflect what is happening in the euro/dollar pair. For most of 2022, they showed a frank "bullish" mood of professional players, but at the same time, the European currency was steadily falling. At the moment, the situation is different, but it is not in favor of the euro currency. If earlier the mood was "bullish" and the euro was falling, now the mood is "bearish" and the euro is also falling. Therefore, so far, we do not see any reason for the growth of the euro, because the absolute majority of factors remain against it. During the reporting week, the number of buy-contracts from the non-commercial group decreased by 0.8 thousand, and the number of shorts increased by 7.3 thousand. Accordingly, the net position decreased by about 6.5 thousand contracts. After several weeks of weak growth, the decline in this indicator has resumed, and the mood of major players remains "bearish." From our point of view, this fact very eloquently indicates that at this time, even professional traders still do not believe in the euro currency. The number of buy contracts is lower than the number of sell contracts for non-commercial traders by 43 thousand. Therefore, we can state that not only is the demand for the US dollar high but also the demand for the euro is quite low. The fact that major players are not in a hurry to buy euros may lead to a new, even greater drop. Over the past six months or a year, the euro currency has not been able to show even a tangible correction, let alone something more. The maximum upward correction was about 400 points.
Analysis of fundamental events.
At first glance, there were quite a lot of important events this week. For example, in the US, the Fed minutes and the retail sales report were published. Inflation and GDP in the European Union. But if you look into it, there is nothing important in these reports. The figures for GDP and inflation in the EU were published in the second estimates, so traders were ready for the figures they saw. The Fed's protocol is a mere formality, and retail sales are not such an important report to be able to influence the mood of traders specifically. So it turns out that the euro currency resumed falling solely due to "technology" and "foundation", which have not changed much lately. We believe that the pair may well continue to fall for a few more months. Only when the Fed announces the end of the cycle of tightening monetary policy will it be possible to expect the completion of the campaign in the south. But where will the euro currency be at that moment?
Trading plan for the week of August 22–26:
1) In the 24-hour timeframe, the pair resumed its movement to its 20-year lows. Almost all factors still speak in favor of the long-term growth of the US dollar. Traders failed to overcome the Ichimoku cloud, so the upward movement and purchases of the euro currency are still irrelevant. To do this, you need to wait at least for consolidation above the Senkou Span B line and only then consider long positions.
2) As for the sales of the euro/dollar pair, they are still more relevant now. The price has overcome the critical line, so we expect the fall to continue with a target of 0.9582 (161.8% Fibonacci).
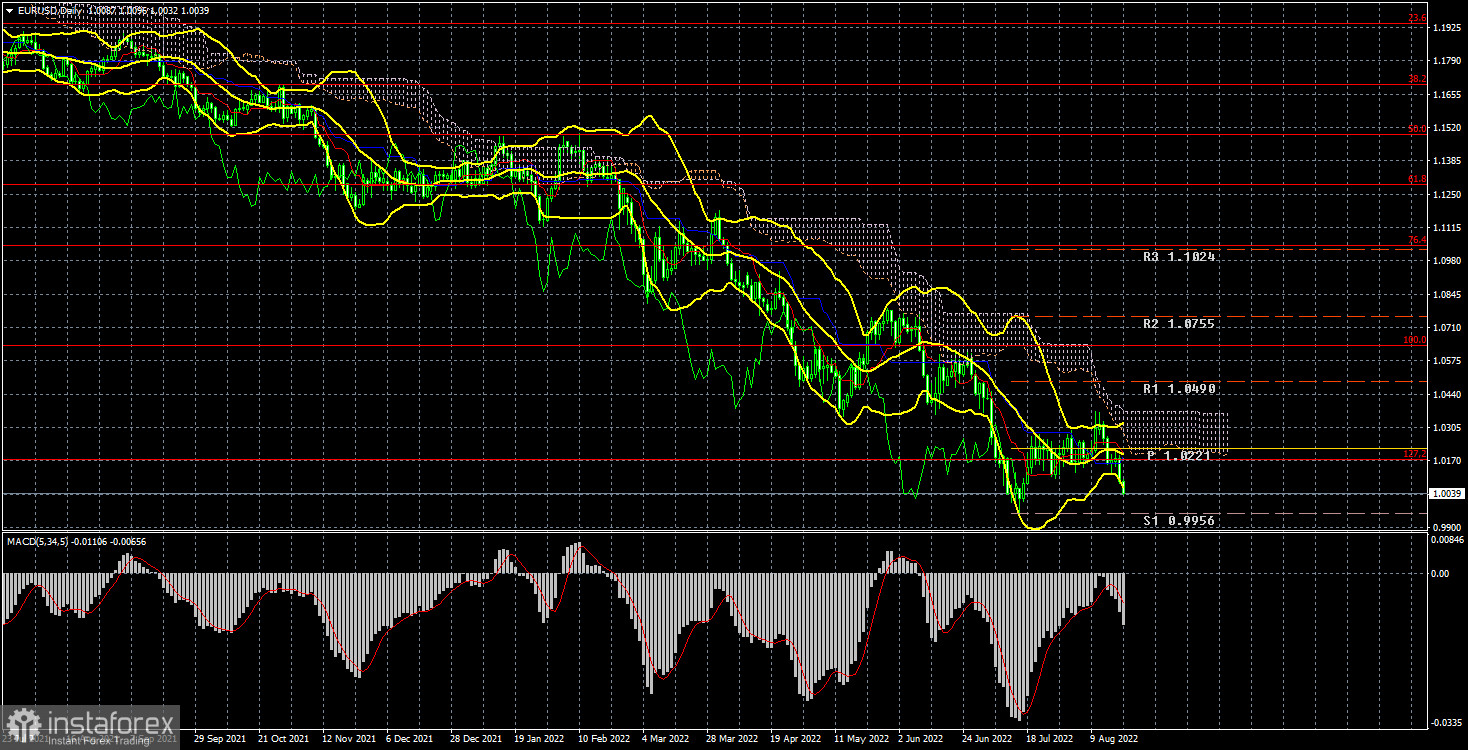
Explanations of the illustrations:
Price levels of support and resistance (resistance /support), Fibonacci levels – levels that are targets when opening purchases or sales. Take Profit levels can be placed near them.
Ichimoku indicators(standard settings), Bollinger Bands (standard settings), MACD (5, 34, 5).
Indicator 1 on the COT charts is the net position size of each category of traders.
Indicator 2 on the COT charts is the net position size for the "Non-commercial" group.


