


Early in the European session, the British pound is trading around 1.2430, above the 21 SMA and below strong resistance (6/8 Murray).
On the 4-hour chart, we can see that the British pound is trading above the downtrend channel forming since March 31. As long as it continues to trade above this level, there is a chance that it will continue to rise.
Yesterday in the European session, the British pound faced strong resistance at 1.2451. Because it could not consolidate above it, a technical correction occurred.
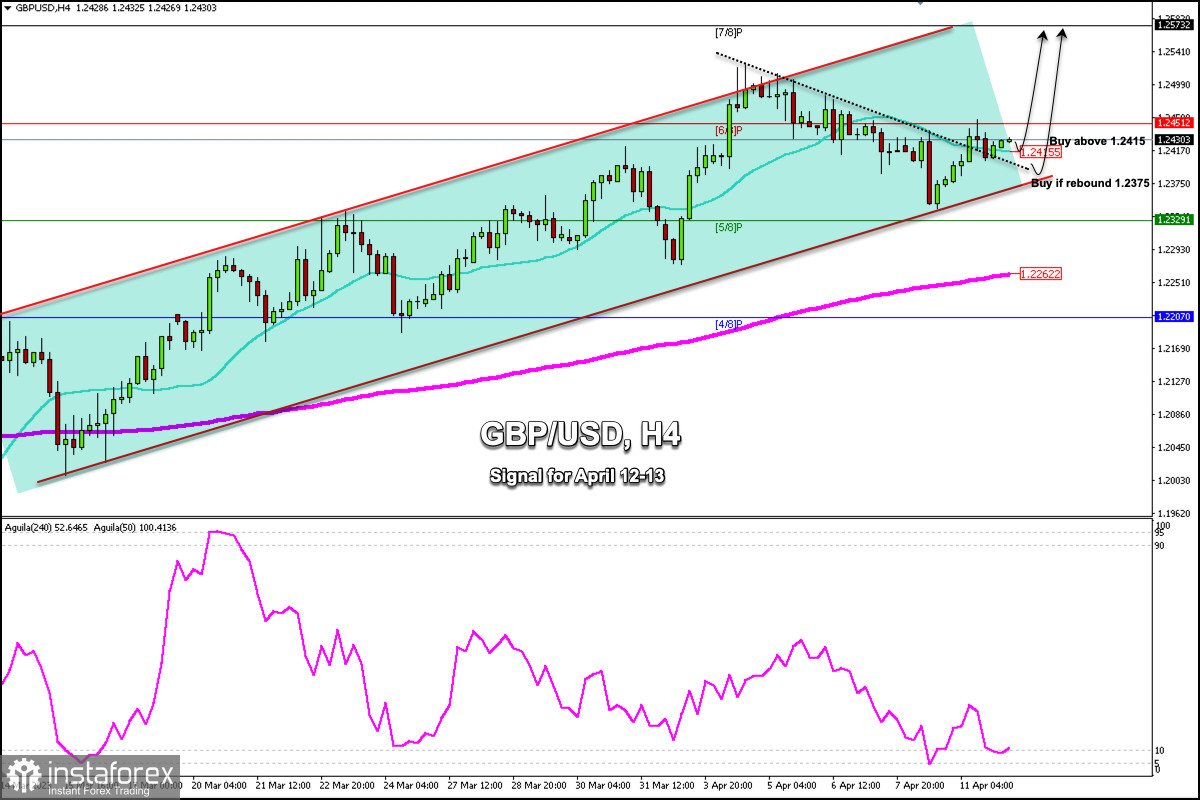
Currently, GBP/USD is showing signs of an uptrend continuation and as long as it consolidates above 1.2375, there is a possibility that it will continue to rise and reach resistance at 1.2573 (7/8 Murray) in the coming days.
At the opening of trade this week, the British pound fell sharply below the 21 SMA and reached the bottom of the uptrend channel. Since then, we have seen a rally and any pullback above 1.2375 will be seen as an opportunity to continue buying.
In the next few hours after the opening of the American session, the US inflation data will be released. It is likely that GBP/USD will show a very strong movement. It could reach the resistance zone of 1.2573 only if the data is negative for the dollar.
On the other hand, with a sharp break below the uptrend channel formed since March 14 and a daily close below 1.2350, GBP/USD could accelerate its downward movement and reach the 200 EMA at 1.2262 and then head toward the 4/8 Murray at 1.2207.
The Eagle indicator is in the oversold zone. As long as it trades above the 5/8 Murray located at 1.2329, we could expect the British pound to continue to bounce toward 1.2573.
Our trading plan for the next few hours is to buy above 1.2415. If there is a bounce above 1.2375, it will be seen as a signal to buy.


