


Trend analysis
EUR/USD quotes will decrease this week, starting from 1.0038 (closing of the last weekly candle) to 1.0038, which is the lower fractal (yellow dotted line). Then, it will move up to the 14.6% retracement level at 1.0071 (yellow dotted line) and to the 23.6% retracement level at 1.0147 (yellow dotted line).
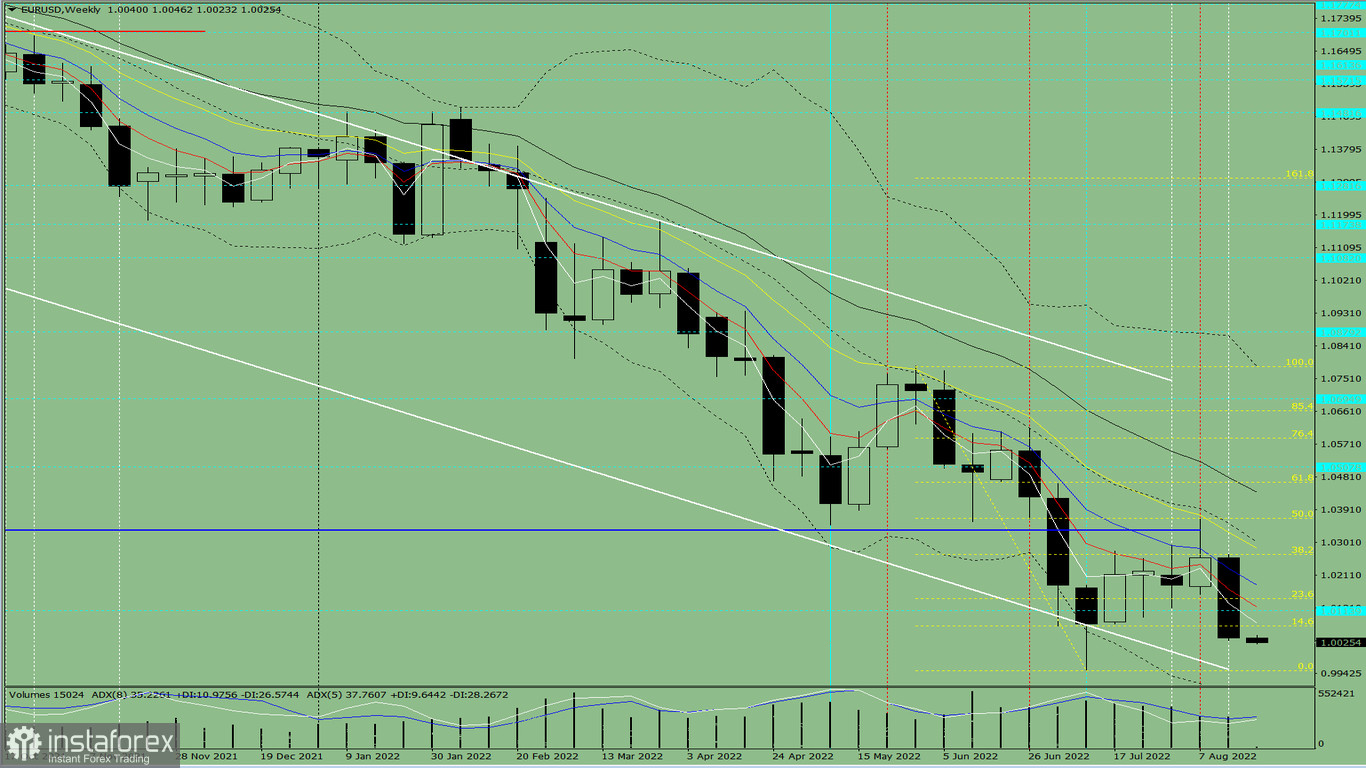
Fig. 1 (weekly chart)
Comprehensive analysis:
Indicator analysis - downtrend
Fibonacci levels - downtrend
Volumes - uptrend
Candlestick analysis - uptrend
Trend analysis - uptrend
Bollinger bands - downtrend
Monthly chart - uptrend
All this points to a downward movement in EUR/USD.
Conclusion: The pair will have a bearish trend, with no first upper shadow on the weekly black candle (Monday - down) and a second lower shadow (Friday - up).
During the week, euro will fall from 1.0038 (closing of the last weekly candle) to the lower fractal at 0.9952 (yellow dotted line), then go to the 14.6% retracement level at 1.0071 (yellow dotted line) and 23.6% retracement level at 1.0147 (yellow dotted line).
Alternatively, the pair could rise from 1.0038 (closing of the last weekly candle) to the 23.6% retracement level at 1.0147 (yellow dotted line), then go to the 38.2% retracement level at 1.0268 (yellow dotted line).


