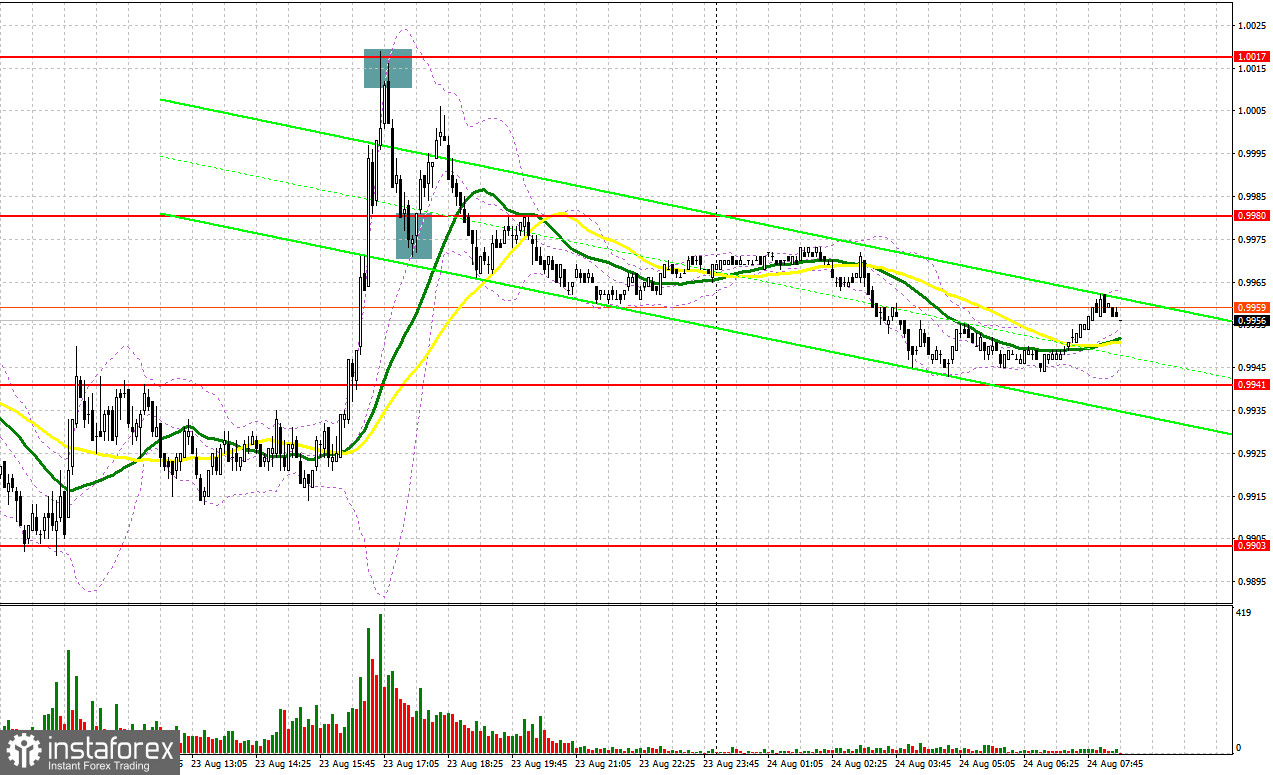
Quite a lot of market entry signals were formed yesterday. Let's take a look at the 5-minute chart and see what happened. I paid attention to the 0.9913 level in my morning forecast and advised you to make decisions on entering the market from it. The whole emphasis was on the weak data on the Eurozone PMI indices. A breakthrough and consolidation below 0.9913 with a reverse test from below to the top, it would seem, gave a good signal to sell further along the trend. However, activity in the euro area was not as bad as economists expected, which did not make it possible for us to see a new major downward movement from the pair. As a result, losses had to be recorded. Growth and a false breakout at 0.9948 led to a sell signal, allowing us to take about 30 points of profit from the market. The euro rose in the afternoon, after the release of weak data on activity in the US and a sharp drop in sales in the housing market. The bears managed to prove themselves only in the area of 1.0017. After forming a false breakout at this level, the downward movement amounted to about 35 points. Buying at the price of 0.9980 in continuation of the bull market brought only about 25 points.

When to go long on EUR/USD:
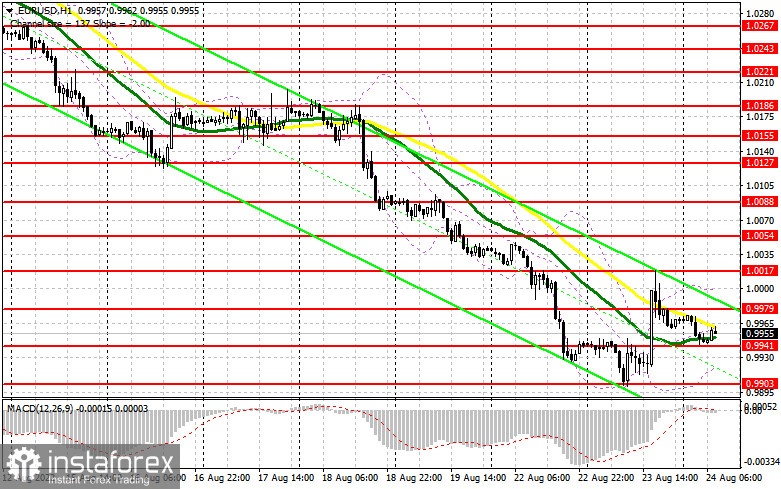
Today there are no statistics on the euro area that could provoke the euro's succeeding growth and given how much the pair plunged after yesterday's growth, this movement can be considered as a short squeeze. Don't be surprised if EUR/USD returns to yearly lows in the near future, counting on the continuation of the bear market after the meeting of US politicians in Jackson Hole, which begins tomorrow. In case the pair falls, forming a false breakout in the area of intermediate support at 0.9941 will provide a signal to open long positions in hopes of further recovery of EUR/USD with the prospect of updating the nearest resistance at 0.9979. A breakthrough and test from top to bottom of this range will hit the bears' stop orders again, creating another signal to enter long positions with the possibility of updating 1.0017, while the resistance at 1.0054 will be a more distant target, where I recommend taking profits.
If the EUR/USD declines and there are no bulls at 0.9941, and this scenario is more realistic, since there are no encouraging statistics on the eurozone today, the pressure on the pair will increase again. In this case, the best option for opening long positions would be a false breakout in the area of the annual low of 0.9903. I advise you to buy EUR/USD immediately on a rebound only from 0.9861, or even lower - around the parity of 0.9819, counting on an upward correction of 30-35 points within the day.
When to go short on EUR/USD:
The bears' main task is to protect the nearest resistance 0.9979, formed on the basis of yesterday. Considering that after a major upsurge amid weak data, people were not especially willing to buy the euro further, we can expect the pair to further move down to annual lows and update them. The optimal scenario for opening short positions would be a false breakout at 0.9979 in the morning, which will lead to the euro sliding down to the 0.9941 area, where the moving averages play on the bulls' side. A breakdown and consolidation below this range with a reverse test from the bottom up creates another sell signal with the removal of bulls' stop orders and a larger drop in the pair to the 0.9903 area, and movement towards 0.9861, where I recommend taking profits. A more distant target will be the area of 0.9819.
If EUR/USD jumps up during the European session, as well as the absence of bears at 0.9979, there will be an opportunity for the implementation of an option with further profit-taking on short positions before an important meeting in Jackson Hole, which will change the situation in favor of the bulls. In this case, I advise you to postpone short positions until 1.0017, but only if a false breakout is formed there. You can sell EUR/USD immediately for a rebound from the high of 1.0054, or even higher - from 1.0088, counting on a downward correction of 30-35 points.

COT report:
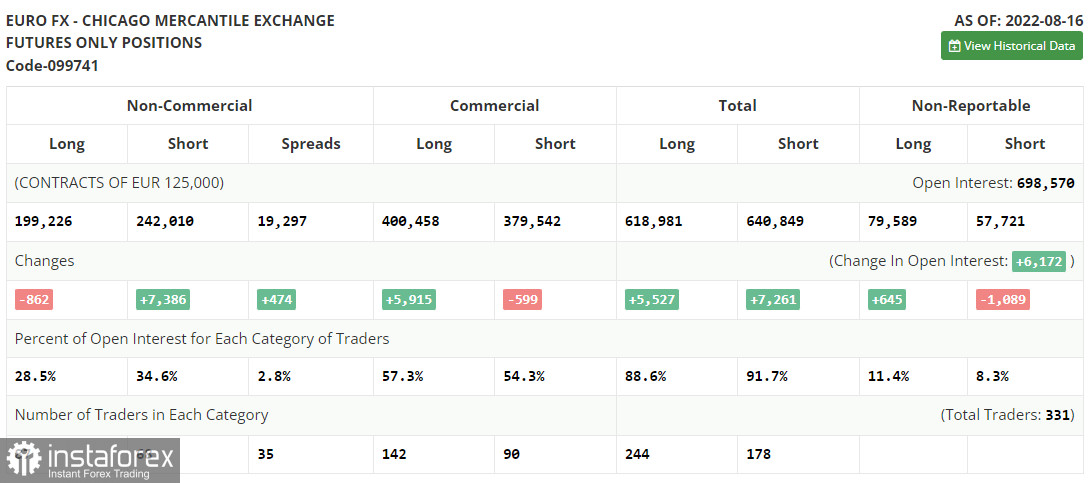
The Commitment of Traders (COT) report for August 16 logged a sharp growth in short positions and a decline in long positions, which confirms the euro's current position against the US dollar. The risk of a looming recession in the US is now combined with the risk of more serious problems in the eurozone, which will begin this autumn amid a sharp rise in energy prices and further inflation, which the European Central Bank is fighting at a fairly moderate pace so far. At the end of this month, American politicians will have a meeting at Jackson Hole, where the key word will be Federal Reserve Chairman Jerome Powell. The pair's succeeding direction will depend on this, as a strong dollar harms the American economy and further accelerates inflation, which the central bank is fighting against. The COT report indicated that long non-commercial positions decreased by 862 to 199,226, while short non-commercial positions jumped by 7,386 to 242,010. At the end of the week, the total non-commercial net position remained negative and fell to -42,784 against -34 536, which indicates that the euro could be under pressure again and may also fall further. The weekly closing price decreased and amounted to 1.0191 against 1.0233.

Indicator signals:
Moving averages
Trading is above the 30 and 50-day moving averages, indicating that the bulls are trying to maintain the correction.
Note: The period and prices of moving averages are considered by the author on the H1 hourly chart and differs from the general definition of the classic daily moving averages on the daily D1 chart.
Bollinger Bands
In case of a decline, the lower border of the indicator around 0.9930 will act as support. In case of growth, the upper border of the indicator in the area of 1.0005 will act as resistance.
Description of indicators
- Moving average (moving average, determines the current trend by smoothing out volatility and noise). Period 50. It is marked in yellow on the chart.
- Moving average (moving average, determines the current trend by smoothing out volatility and noise). Period 30. It is marked in green on the chart.
- MACD indicator (Moving Average Convergence/Divergence — convergence/divergence of moving averages) Quick EMA period 12. Slow EMA period to 26. SMA period 9
- Bollinger Bands (Bollinger Bands). Period 20
- Non-commercial speculative traders, such as individual traders, hedge funds, and large institutions that use the futures market for speculative purposes and meet certain requirements.
- Long non-commercial positions represent the total long open position of non-commercial traders.
- Short non-commercial positions represent the total short open position of non-commercial traders.
- Total non-commercial net position is the difference between short and long positions of non-commercial traders.


