


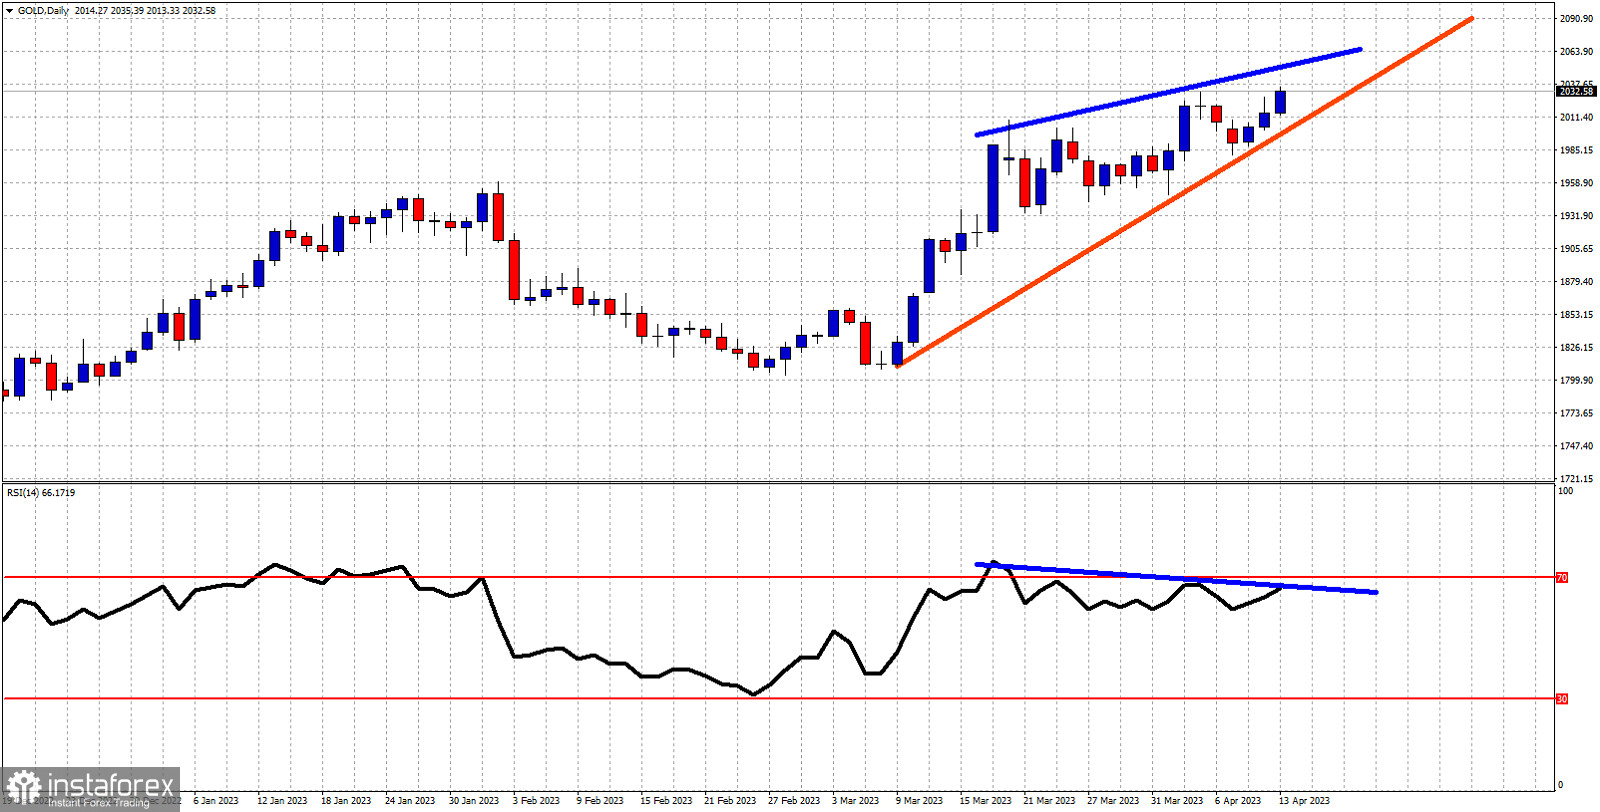
Blue lines- bearish divergence
Red line -support trend line
Gold is approaching its weekly and all time highs. Price is trading very close to $2,030. Price continues making higher highs and higher lows. Support is found at $1,998 for the near term. As long as price is above this level, short-term trend remains bullish. The RSI has provided us with an important warning that should not be ignored. The bearish RSI divergence suggests that the up trend is weakening. Will we see a triple top rejection around $2,070? Such a rejection would be a bearish signal and could signal the start of a bigger pull back towards $1,800-$1,600. If price breaks below the red upward sloping trend line, bulls will then need to defend the $1,804 low.


